Avantor Investor Presentation Deck
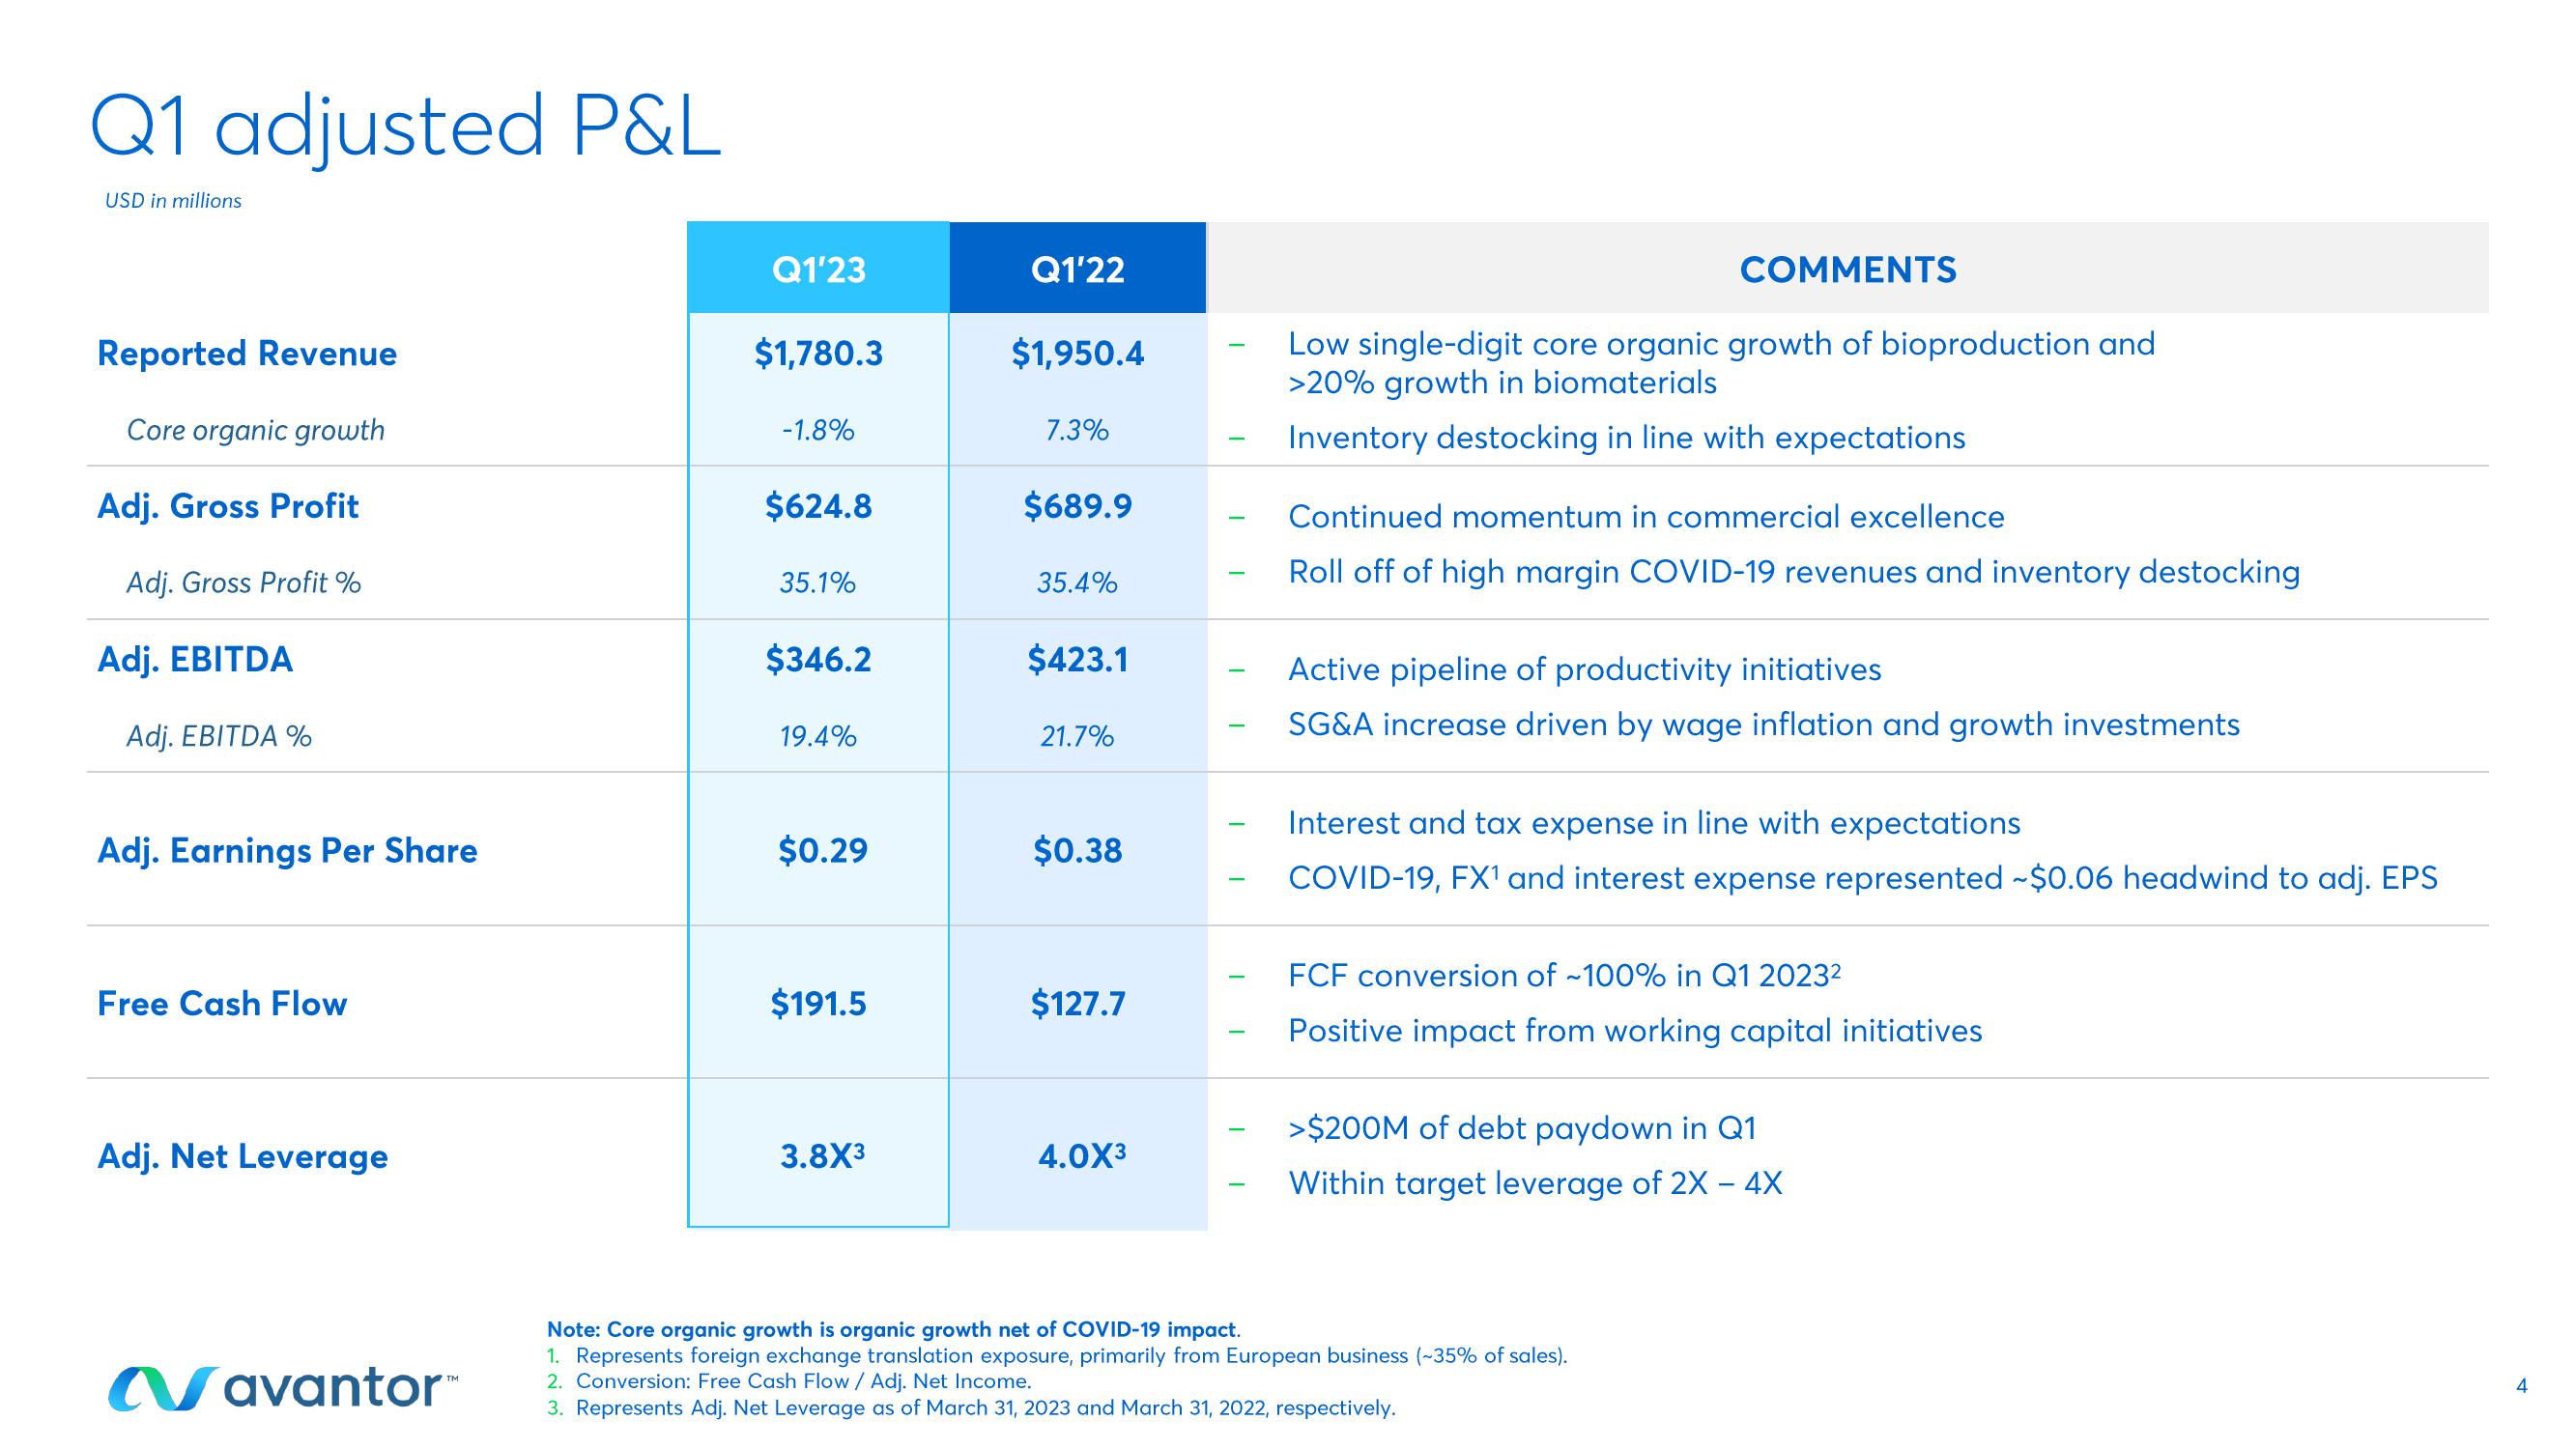
Q1 adjusted P&L
USD in millions
Reported Revenue
Core organic growth
Adj. Gross Profit
Adj. Gross Profit %
Adj. EBITDA
Adj. EBITDA %
Adj. Earnings Per Share
Free Cash Flow
Adj. Net Leverage
Navantor™
Q1'23
$1,780.3
-1.8%
$624.8
35.1%
$346.2
19.4%
$0.29
$191.5
3.8X3
Q1'22
$1,950.4
7.3%
$689.9
35.4%
$423.1
21.7%
$0.38
$127.7
4.0X³
T
COMMENTS
Low single-digit core organic growth of bioproduction and
>20% growth in biomaterials
Inventory destocking in line with expectations
Continued momentum in commercial excellence
Roll off of high margin COVID-19 revenues and inventory destocking
Active pipeline of productivity initiatives
SG&A increase driven by wage inflation and growth investments
Interest and tax expense in line with expectations
COVID-19, FX¹ and interest expense represented ~$0.06 headwind to adj. EPS
FCF conversion of ~100% in Q1 2023²
Positive impact from working capital initiatives
>$200M of debt paydown in Q1
Within target leverage of 2X - 4X
Note: Core organic growth is organic growth net of COVID-19 impact.
1. Represents foreign exchange translation exposure, primarily from European business (~35% of sales).
2. Conversion: Free Cash Flow / Adj. Net Income.
3. Represents Adj. Net Leverage as of March 31, 2023 and March 31, 2022, respectively.
4View entire presentation