Silicon Valley Bank Results Presentation Deck
Non-GAAP reconciliation*
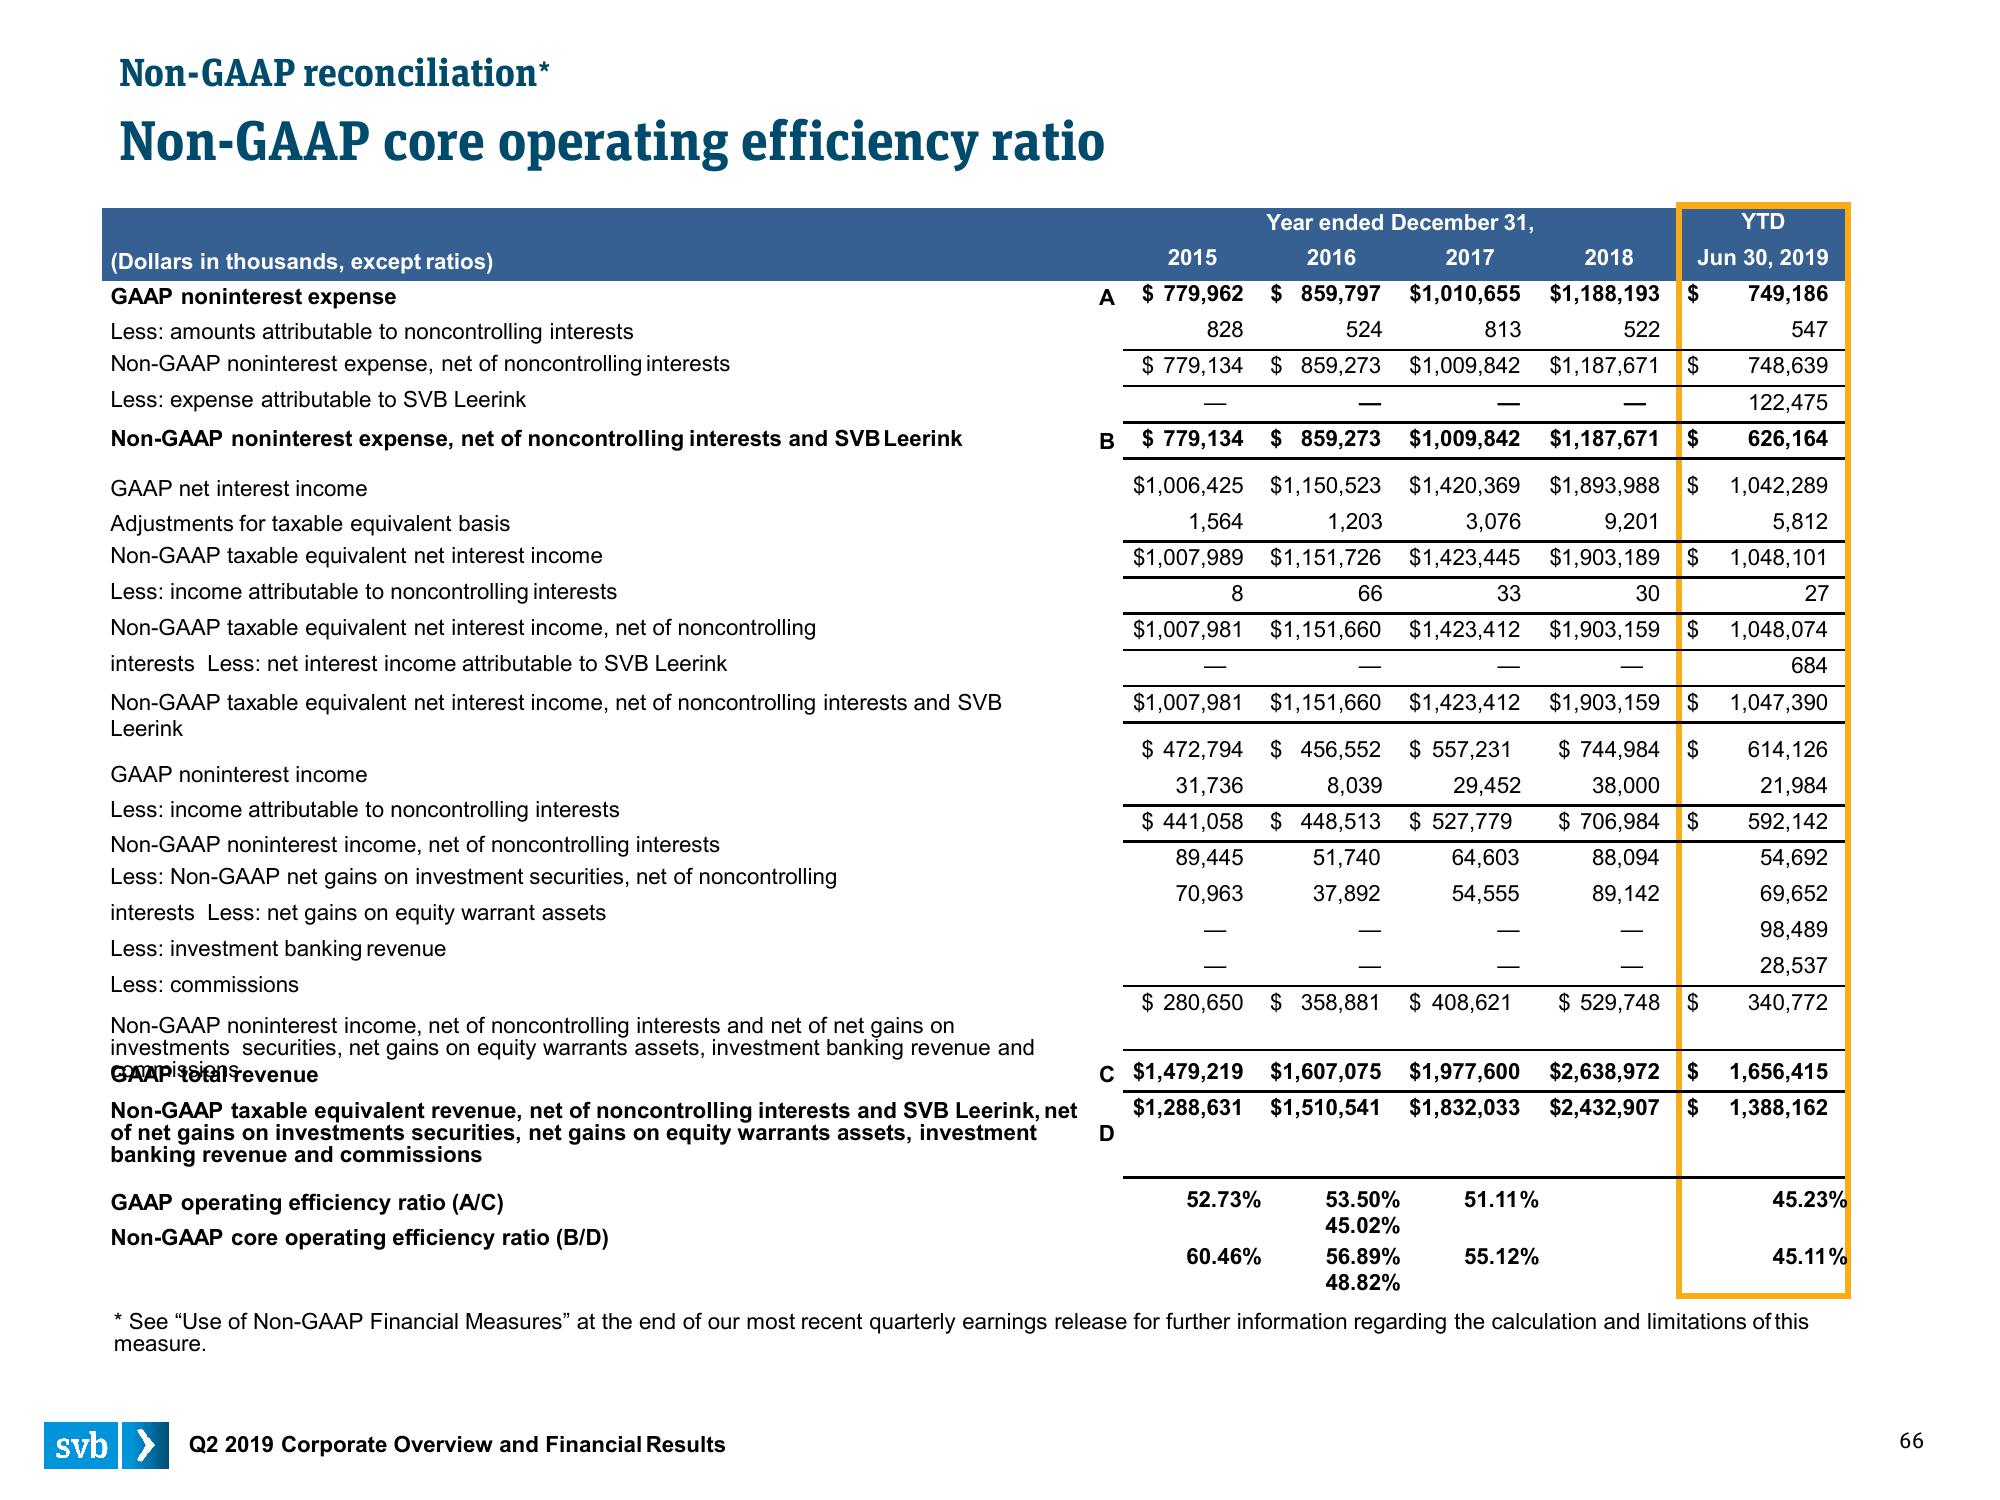
Non-GAAP core operating efficiency ratio
(Dollars in thousands, except ratios)
GAAP noninterest expense
Less: amounts attributable to noncontrolling interests
Non-GAAP noninterest expense, net of noncontrolling interests
Less: expense attributable to SVB Leerink
Non-GAAP noninterest expense, net of noncontrolling interests and SVB Leerink
GAAP net interest income
Adjustments for taxable equivalent basis
Non-GAAP taxable equivalent net interest income
Less: income attributable to noncontrolling interests
Non-GAAP taxable equivalent net interest income, net of noncontrolling
interests Less: net interest income attributable to SVB Leerink
Non-GAAP taxable equivalent net interest income, net of noncontrolling interests and SVB
Leerink
GAAP noninterest income
Less: income attributable to noncontrolling interests
Non-GAAP noninterest income, net of noncontrolling interests
Less: Non-GAAP net gains on investment securities, net of noncontrolling
interests Less: net gains on equity warrant assets
Less: investment banking revenue
Less: commissions
Non-GAAP noninterest income, net of noncontrolling interests and net of net gains on
investments securities, net gains on equity warrants assets, investment banking revenue and
GAVPistal revenue
Non-GAAP taxable equivalent revenue, net of noncontrolling interests and SVB Leerink, net
of net gains on investments securities, net gains on equity warrants assets, investment
banking revenue and commissions
GAAP operating efficiency ratio (A/C)
Non-GAAP core operating efficiency ratio (B/D)
A
svb> Q2 2019 Corporate Overview and Financial Results
B
Year ended December 31,
2015
$ 779,962
828
2016
$859,797
524
$ 779,134 $ 859,273
D
8
$779,134 $ 859,273 $1,009,842 $1,187,671 $
$1,006,425 $1,150,523 $1,420,369 $1,893,988 $
1,564
1,203
3,076
9,201
$1,007,989 $1,151,726 $1,423,445 $1,903,189 $
66
YTD
2017
2018 Jun 30, 2019
$1,010,655 $1,188,193 $ 749,186
813
547
$1,009,842 $1,187,671 $ 748,639
122,475
626,164
1,042,289
5,812
1,048, 101
27
$1,007,981 $1,151,660 $1,423,412
$1,007,981 $1,151,660 $1,423,412
$ 472,794 $ 456,552 $ 557,231
31,736
8,039
29,452
$441,058 $448,513 $ 527,779
89,445 51,740
64,603
70,963 37,892
54,555
52.73%
C $1,479,219 $1,607,075 $1,977,600
$1,288,631 $1,510,541 $1,832,033
60.46%
33
53.50%
45.02%
56.89%
48.82%
$ 280,650 $ 358,881 $ 408,621 $529,748 $
522
51.11%
55.12%
30
$1,903,159 $
$1,903,159 $
$744,984 $
38,000
$706,984 $
88,094
89,142
$2,638,972 $
$2,432,907 $
1,048,074
684
1,047,390
614,126
21,984
592,142
54,692
69,652
98,489
28,537
340,772
1,656,415
1,388,162
45.23%
45.11%
See "Use of Non-GAAP Financial Measures" at the end of our most recent quarterly earnings release for further information regarding the calculation and limitations of this
measure.
66View entire presentation