DraftKings Investor Day Presentation Deck
Detailed overview of methodology for cohort customer retention and revenue
retention
Acquisition Quarter, Consecutive Full Quarters of Data
Q3
2018
Acq.
●
●
●
State
-
NJ
WV
IN
PA
Acquired
Cohort
Q3 2018
Q4 2019
Q1 2019
Q2 2019
Q3 2019
Q4 2019
Q3 2019
Q4 2019
Q4 2019
Q4 2019
Two Year Cohorts
One Year Cohorts
Q4
2018
1
Acq.
Q1
2019
2
1
Acq.
Q2
2019
3
2
1
Acq.
Q3
2019
4
3
2
1
Acq.
Acq.
Q4
2019
5
4
2
1
Acq.
1
Acq.
Acq.
Acq.
Q1
2020
6
5
4
3
2
1
2
1
1
1
Q2
2020
7
6
5
4
3
3
2
Q3
2020
8
7
6
5
4
3
4
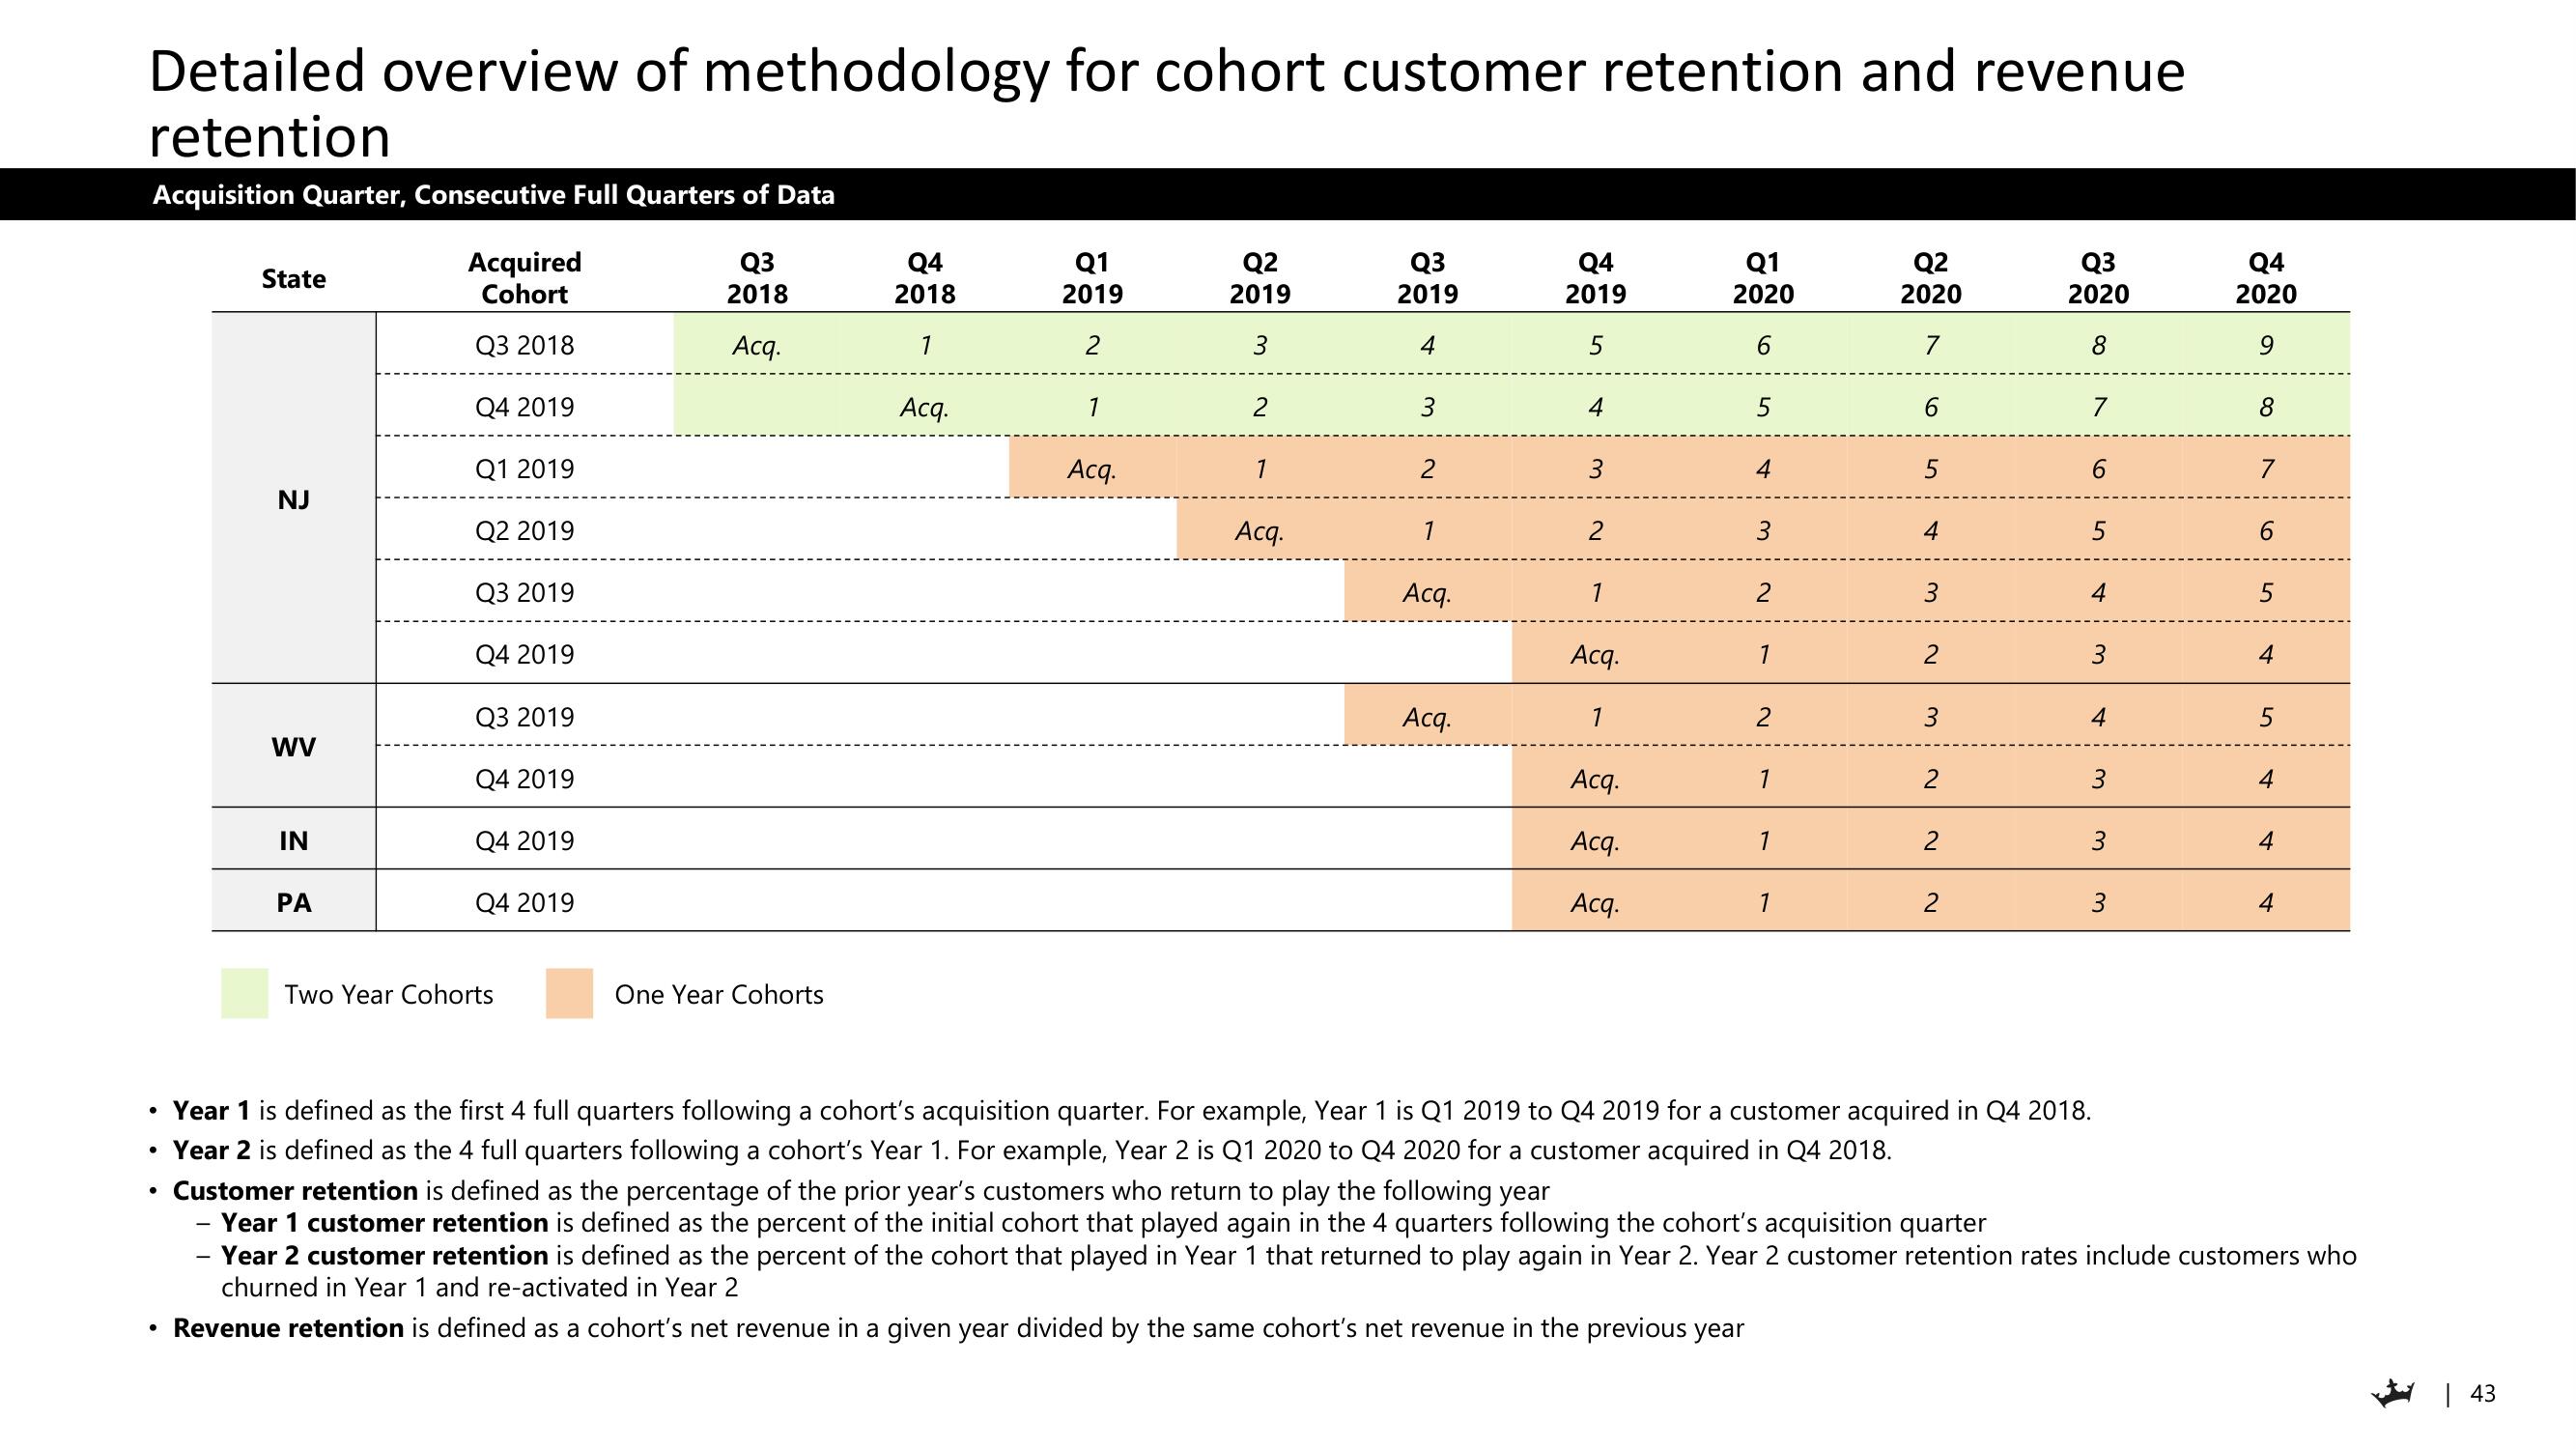
• Year 1 is defined as the first 4 full quarters following a cohort's acquisition quarter. For example, Year 1 is Q1 2019 to Q4 2019 for a customer acquired in Q4 2018.
Year 2 is defined as the 4 full quarters following a cohort's Year 1. For example, Year 2 is Q1 2020 to Q4 2020 for a customer acquired in Q4 2018.
Customer retention is defined as the percentage of the prior year's customers who return to play the following year
Year 1 customer retention is defined as the percent of the initial cohort that played again in the 4 quarters following the cohort's acquisition quarter
3
3
3
Q4
2020
9
8
6
5
4
5
4
4
4
- Year 2 customer retention is defined as the percent of the cohort that played in Year 1 that returned to play again in Year 2. Year 2 customer retention rates include customers who
churned in Year 1 and re-activated in Year 2
Revenue retention is defined as a cohort's net revenue in a given year divided by the same cohort's net revenue in the previous year
| 43View entire presentation