Rover Investor Update
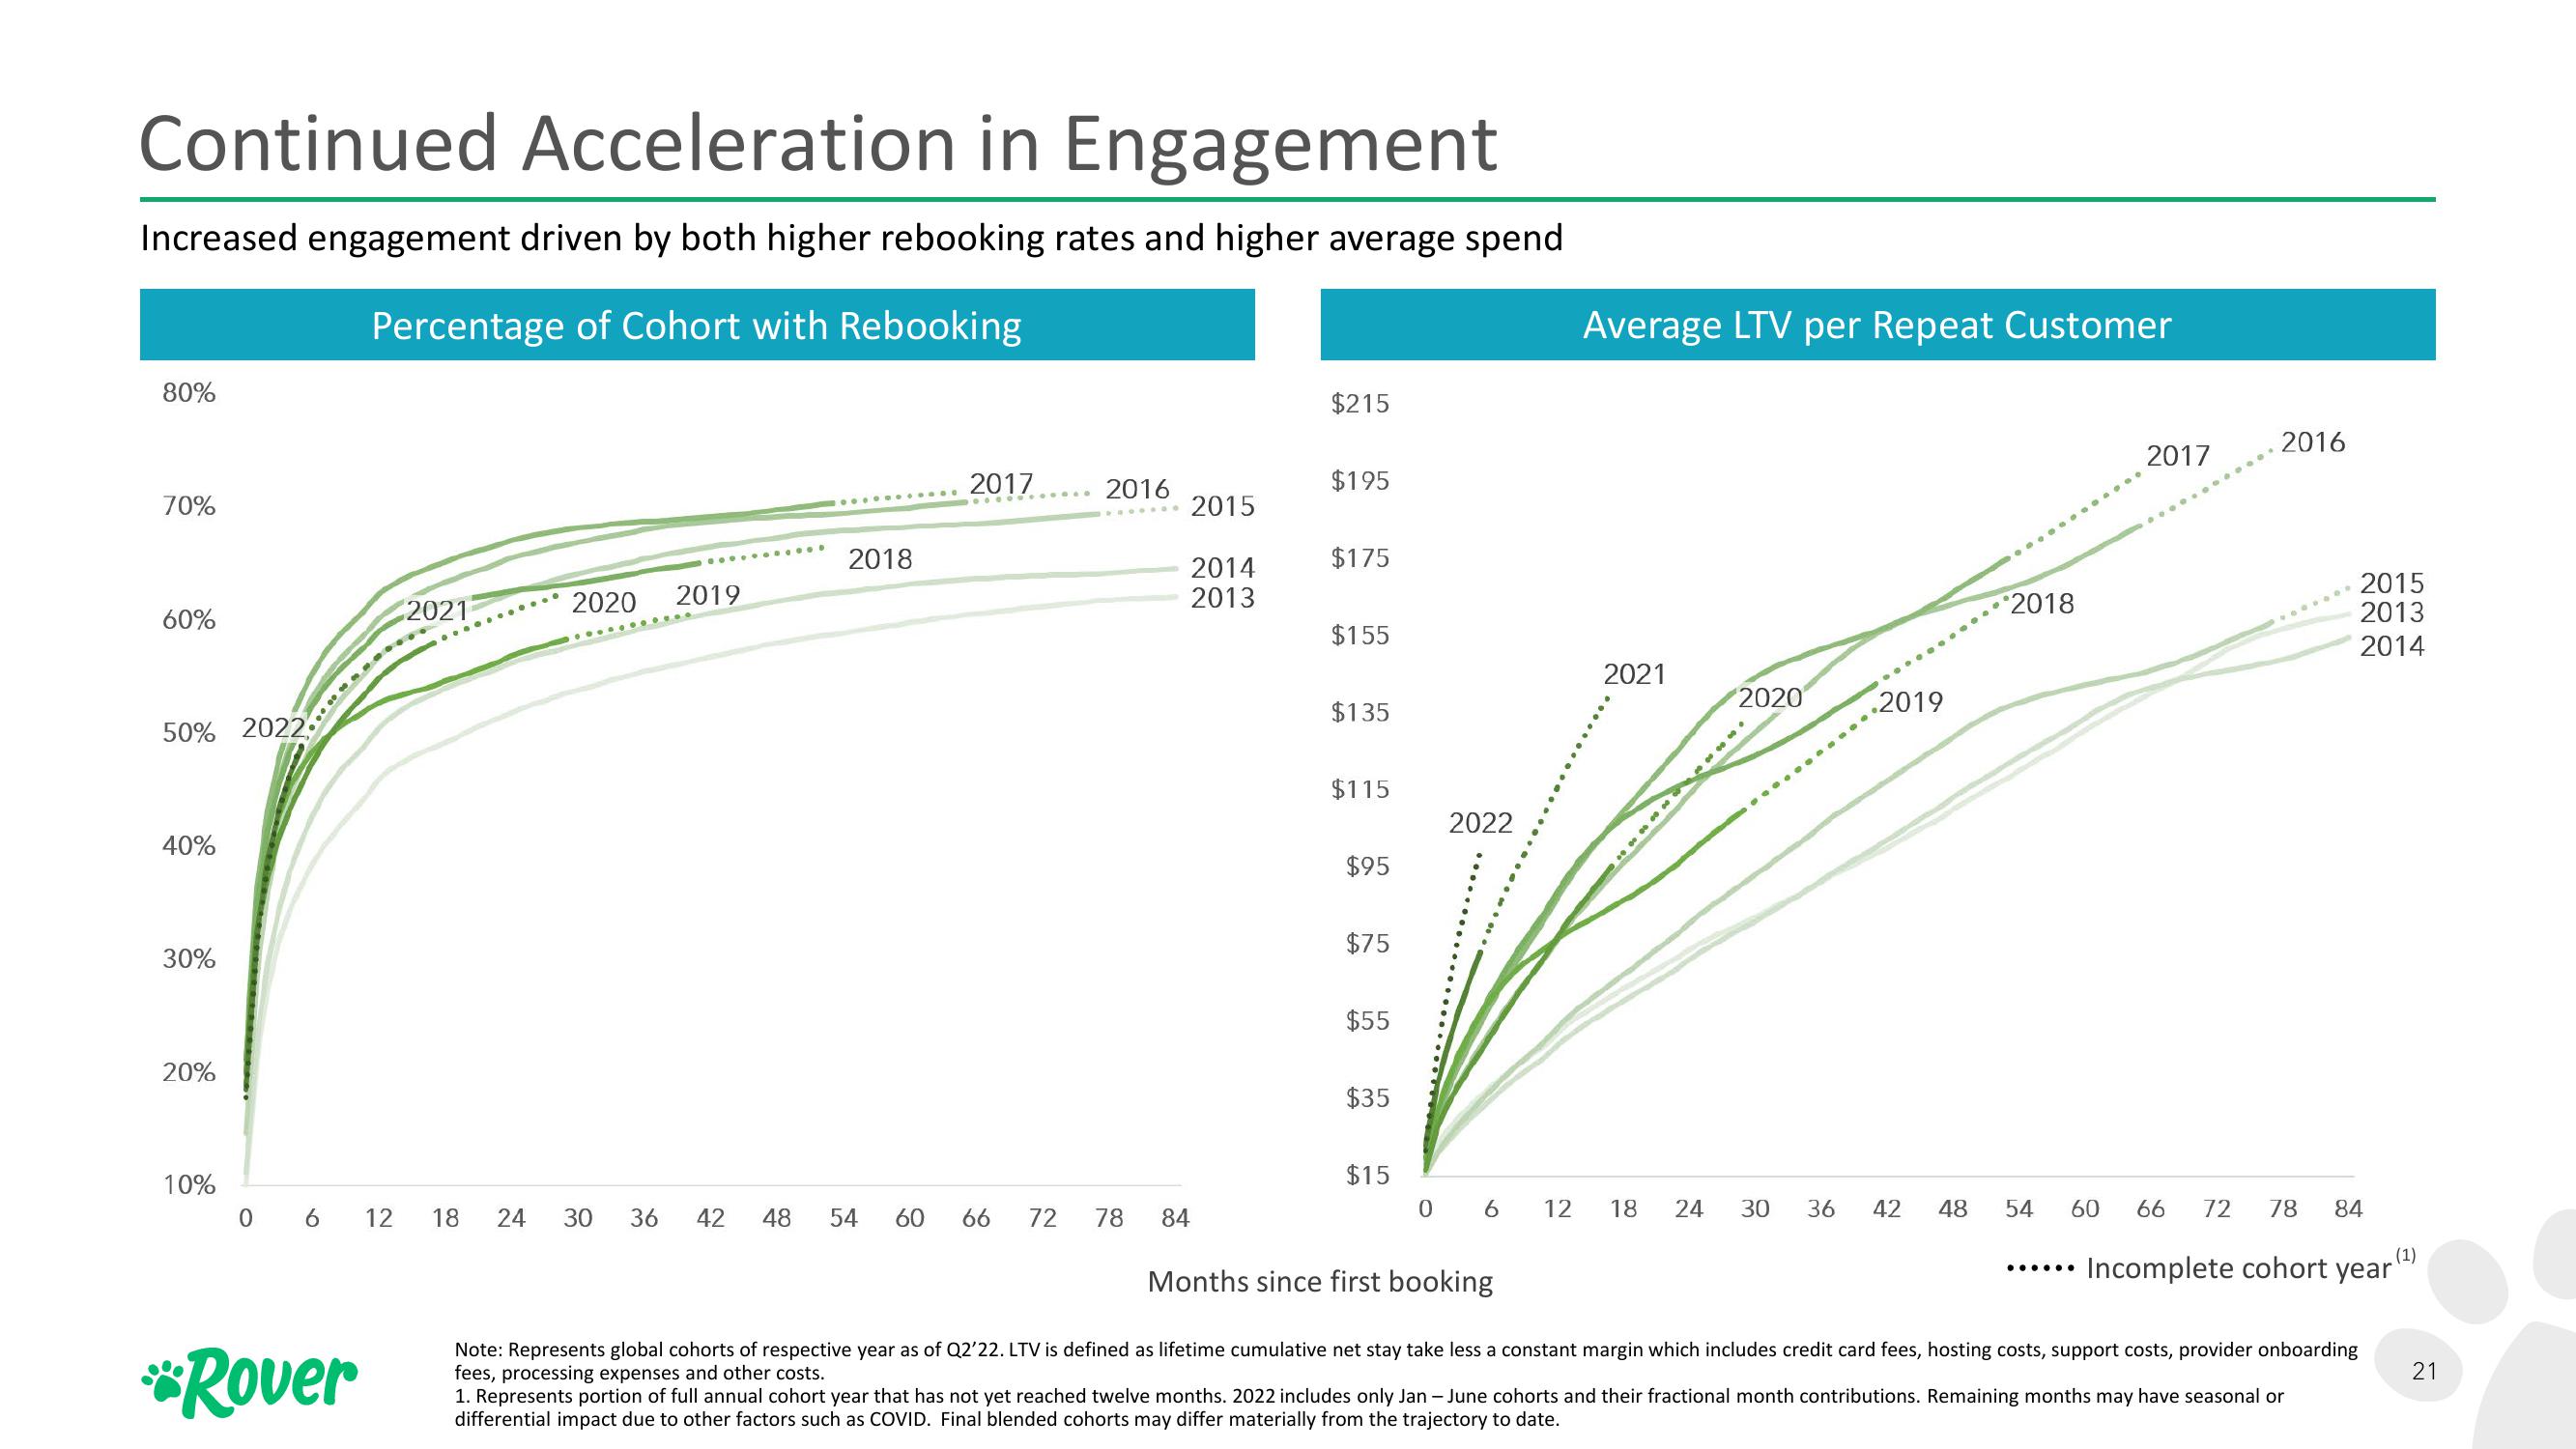
Continued Acceleration in Engagement.
Increased engagement driven by both higher rebooking rates and higher average spend
Percentage of Cohort with Rebooking
80%
70%
60%
50% 20226
40%
30%
20%
10%
*...*
06 12
**Rover
2021
2020 2019
18 24 30
36
2018
42 48 54 60
2017
.........
66 72
2016
78
2015
2014
2013
84
$215
$195
$175
$155
$135
$115
$95
$75
$55
$35
$15
2022
06
Months since first booking
12
Average LTV per Repeat Customer
2021
18
*****
24
2020
30 36
.2019
42
48
2018
54
60
......
2017
66
2016
72 78
2015
2013
2014
84
(1)
Incomplete cohort year'
Note: Represents global cohorts of respective year as of Q2'22. LTV is defined as lifetime cumulative net stay take less a constant margin which includes credit card fees, hosting costs, support costs, provider onboarding
fees, processing expenses and other costs.
1. Represents portion of full annual cohort year that has not yet reached twelve months. 2022 includes only Jan - June cohorts and their fractional month contributions. Remaining months may have seasonal or
differential impact due to other factors such as COVID. Final blended cohorts may differ materially from the trajectory to date.
21View entire presentation