Nuvve Results Presentation Deck
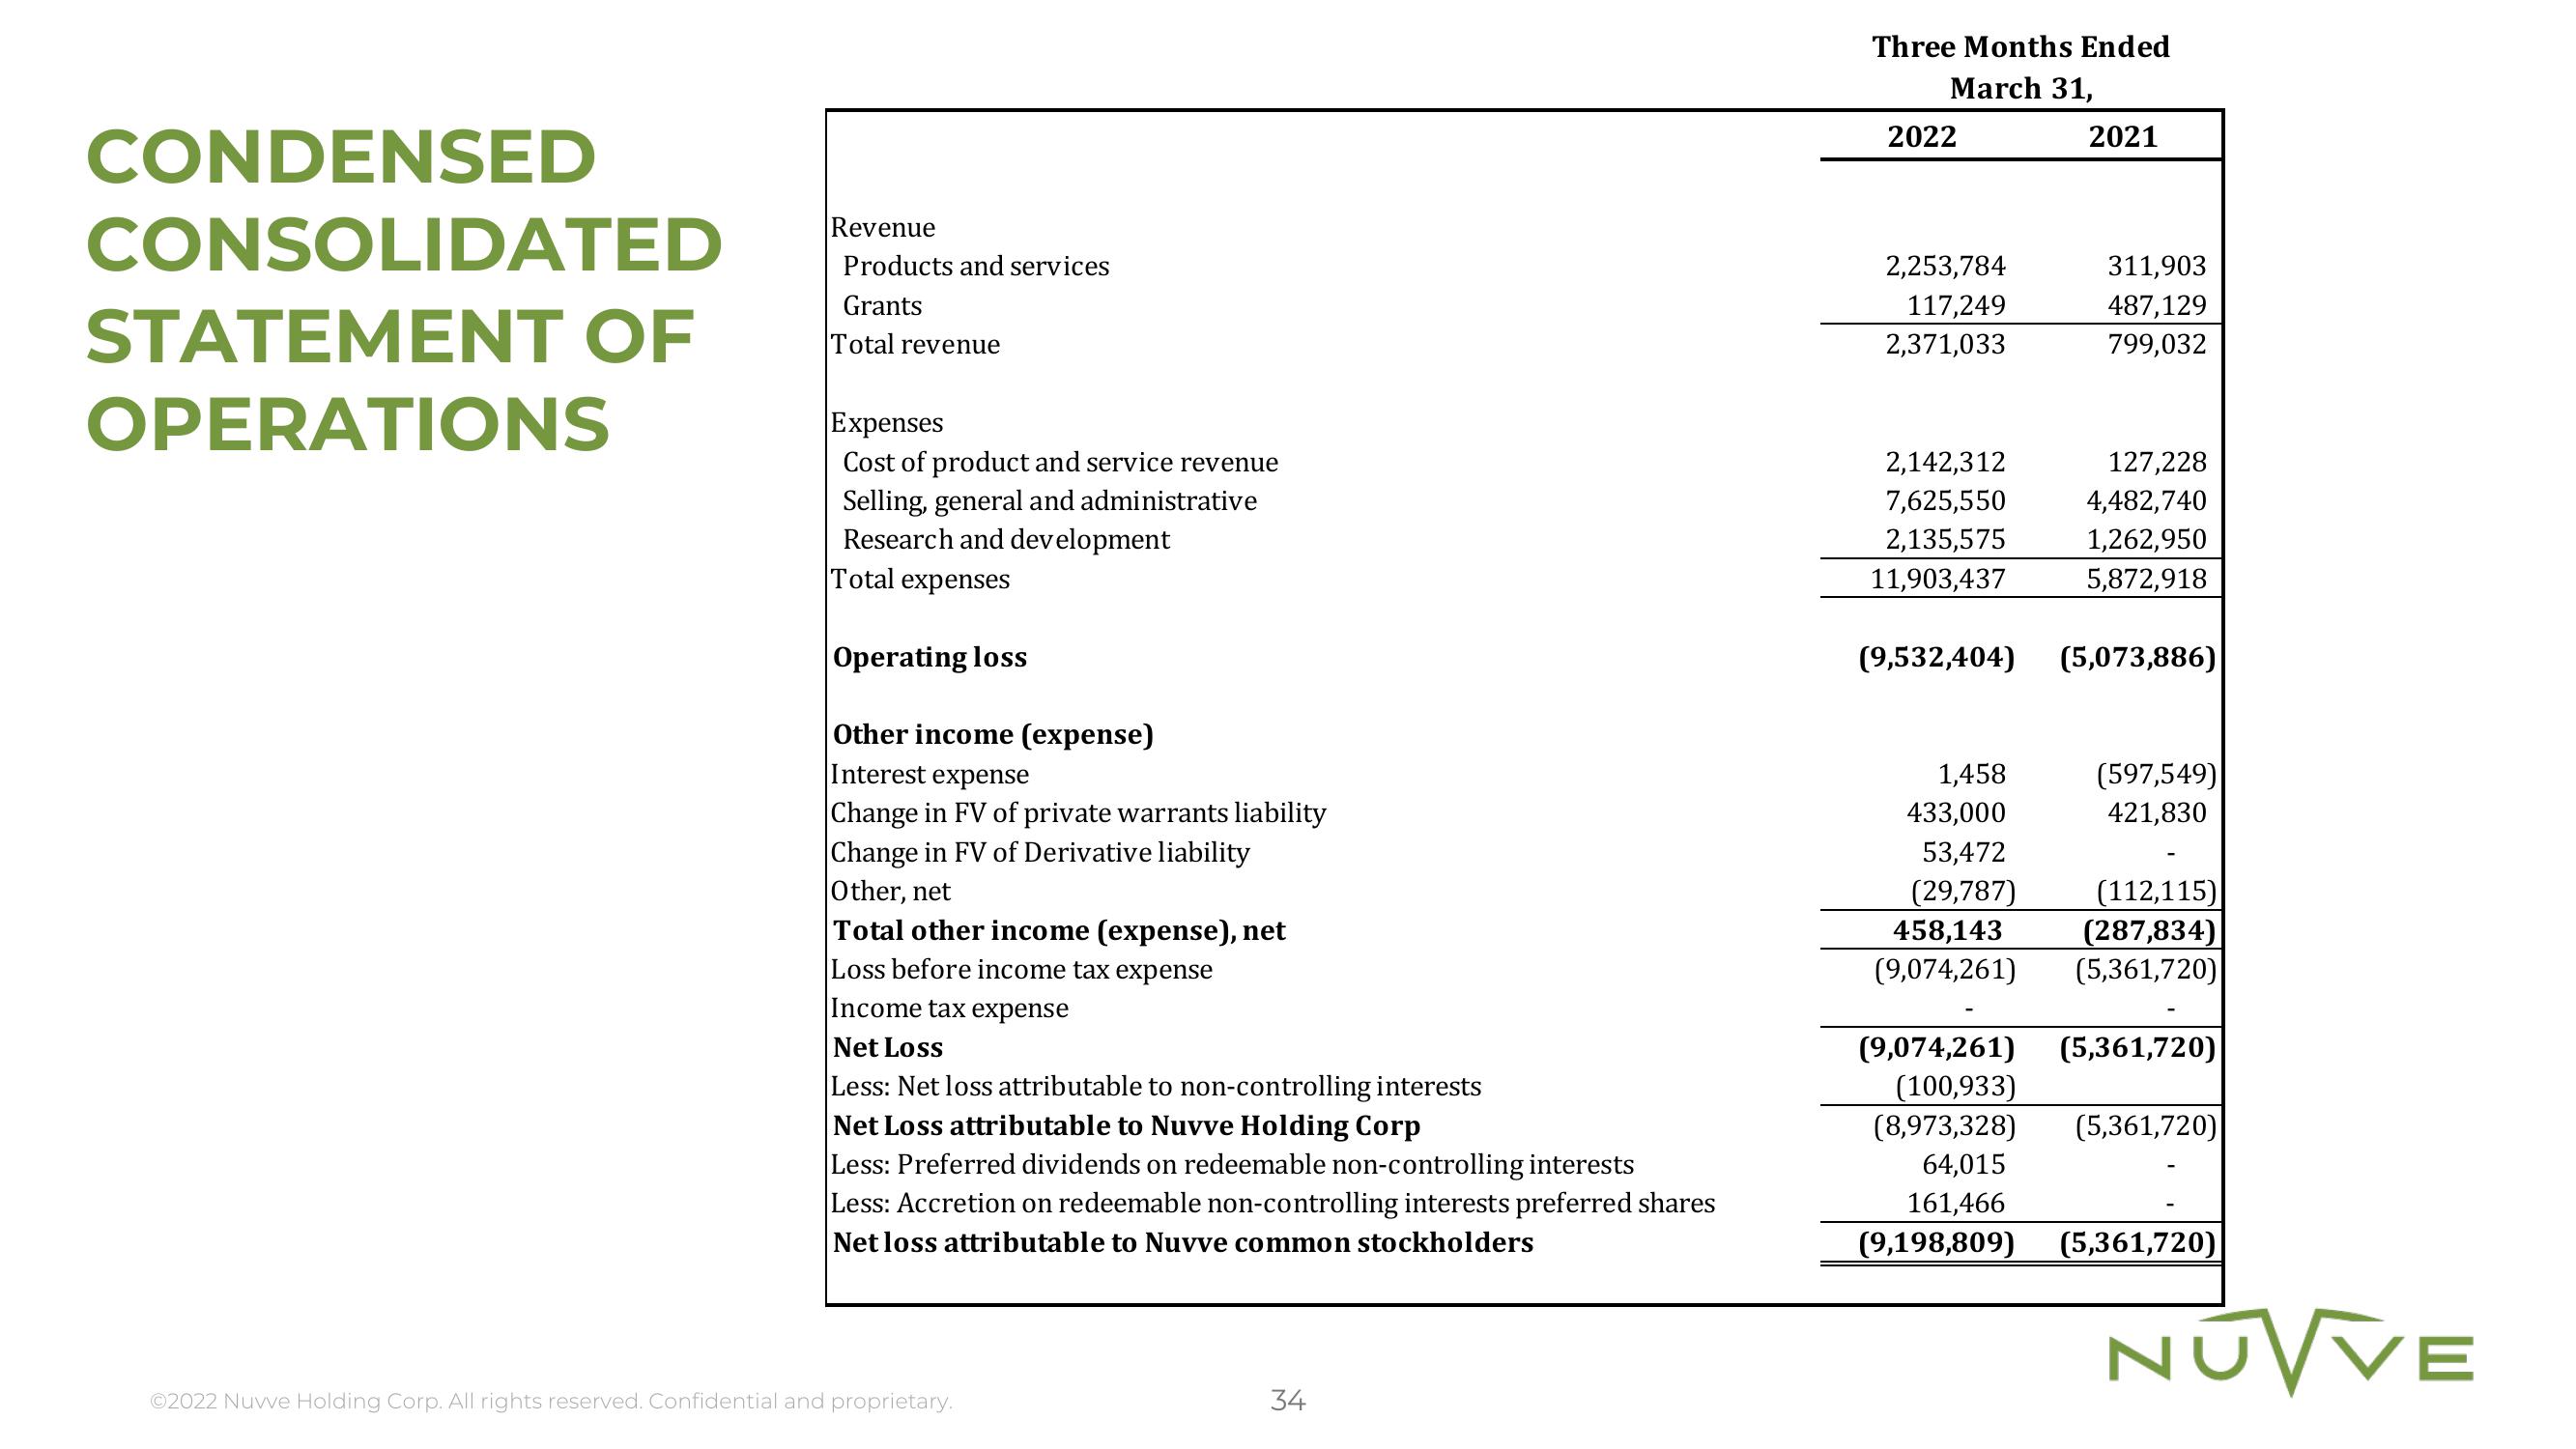
CONDENSED
CONSOLIDATED
STATEMENT OF
OPERATIONS
Revenue
Products and services
Grants
Total revenue
Expenses
Cost of product and service revenue
Selling, general and administrative
Research and development
Total expenses
Operating loss
Other income (expense)
Interest expense
Change in FV of private warrants liability
Change in FV of Derivative liability
Other, net
Total other income (expense), net
Loss before income tax expense
Income tax expense
Net Loss
Less: Net loss attributable to non-controlling interests
Net Loss attributable to Nuvve Holding Corp
Less: Preferred dividends on redeemable non-controlling interests
Less: Accretion on redeemable non-controlling interests preferred shares
Net loss attributable to Nuvve common stockholders
Ⓒ2022 Nuvve Holding Corp. All rights reserved. Confidential and proprietary.
34
Three Months Ended
March 31,
2022
2,253,784
117,249
2,371,033
2,142,312
7,625,550
2,135,575
11,903,437
2021
1,458
433,000
53,472
(29,787)
458,143
(9,074,261)
311,903
487,129
799,032
127,228
4,482,740
1,262,950
5,872,918
(9,532,404) (5,073,886)
(597,549)
421,830
(112,115)
(287,834)
(5,361,720)
(9,074,261) (5,361,720)
(100,933)
(8,973,328) (5,361,720)
64,015
161,466
(9,198,809) (5,361,720)
NUVVEView entire presentation