Citi Investment Banking Pitch Book
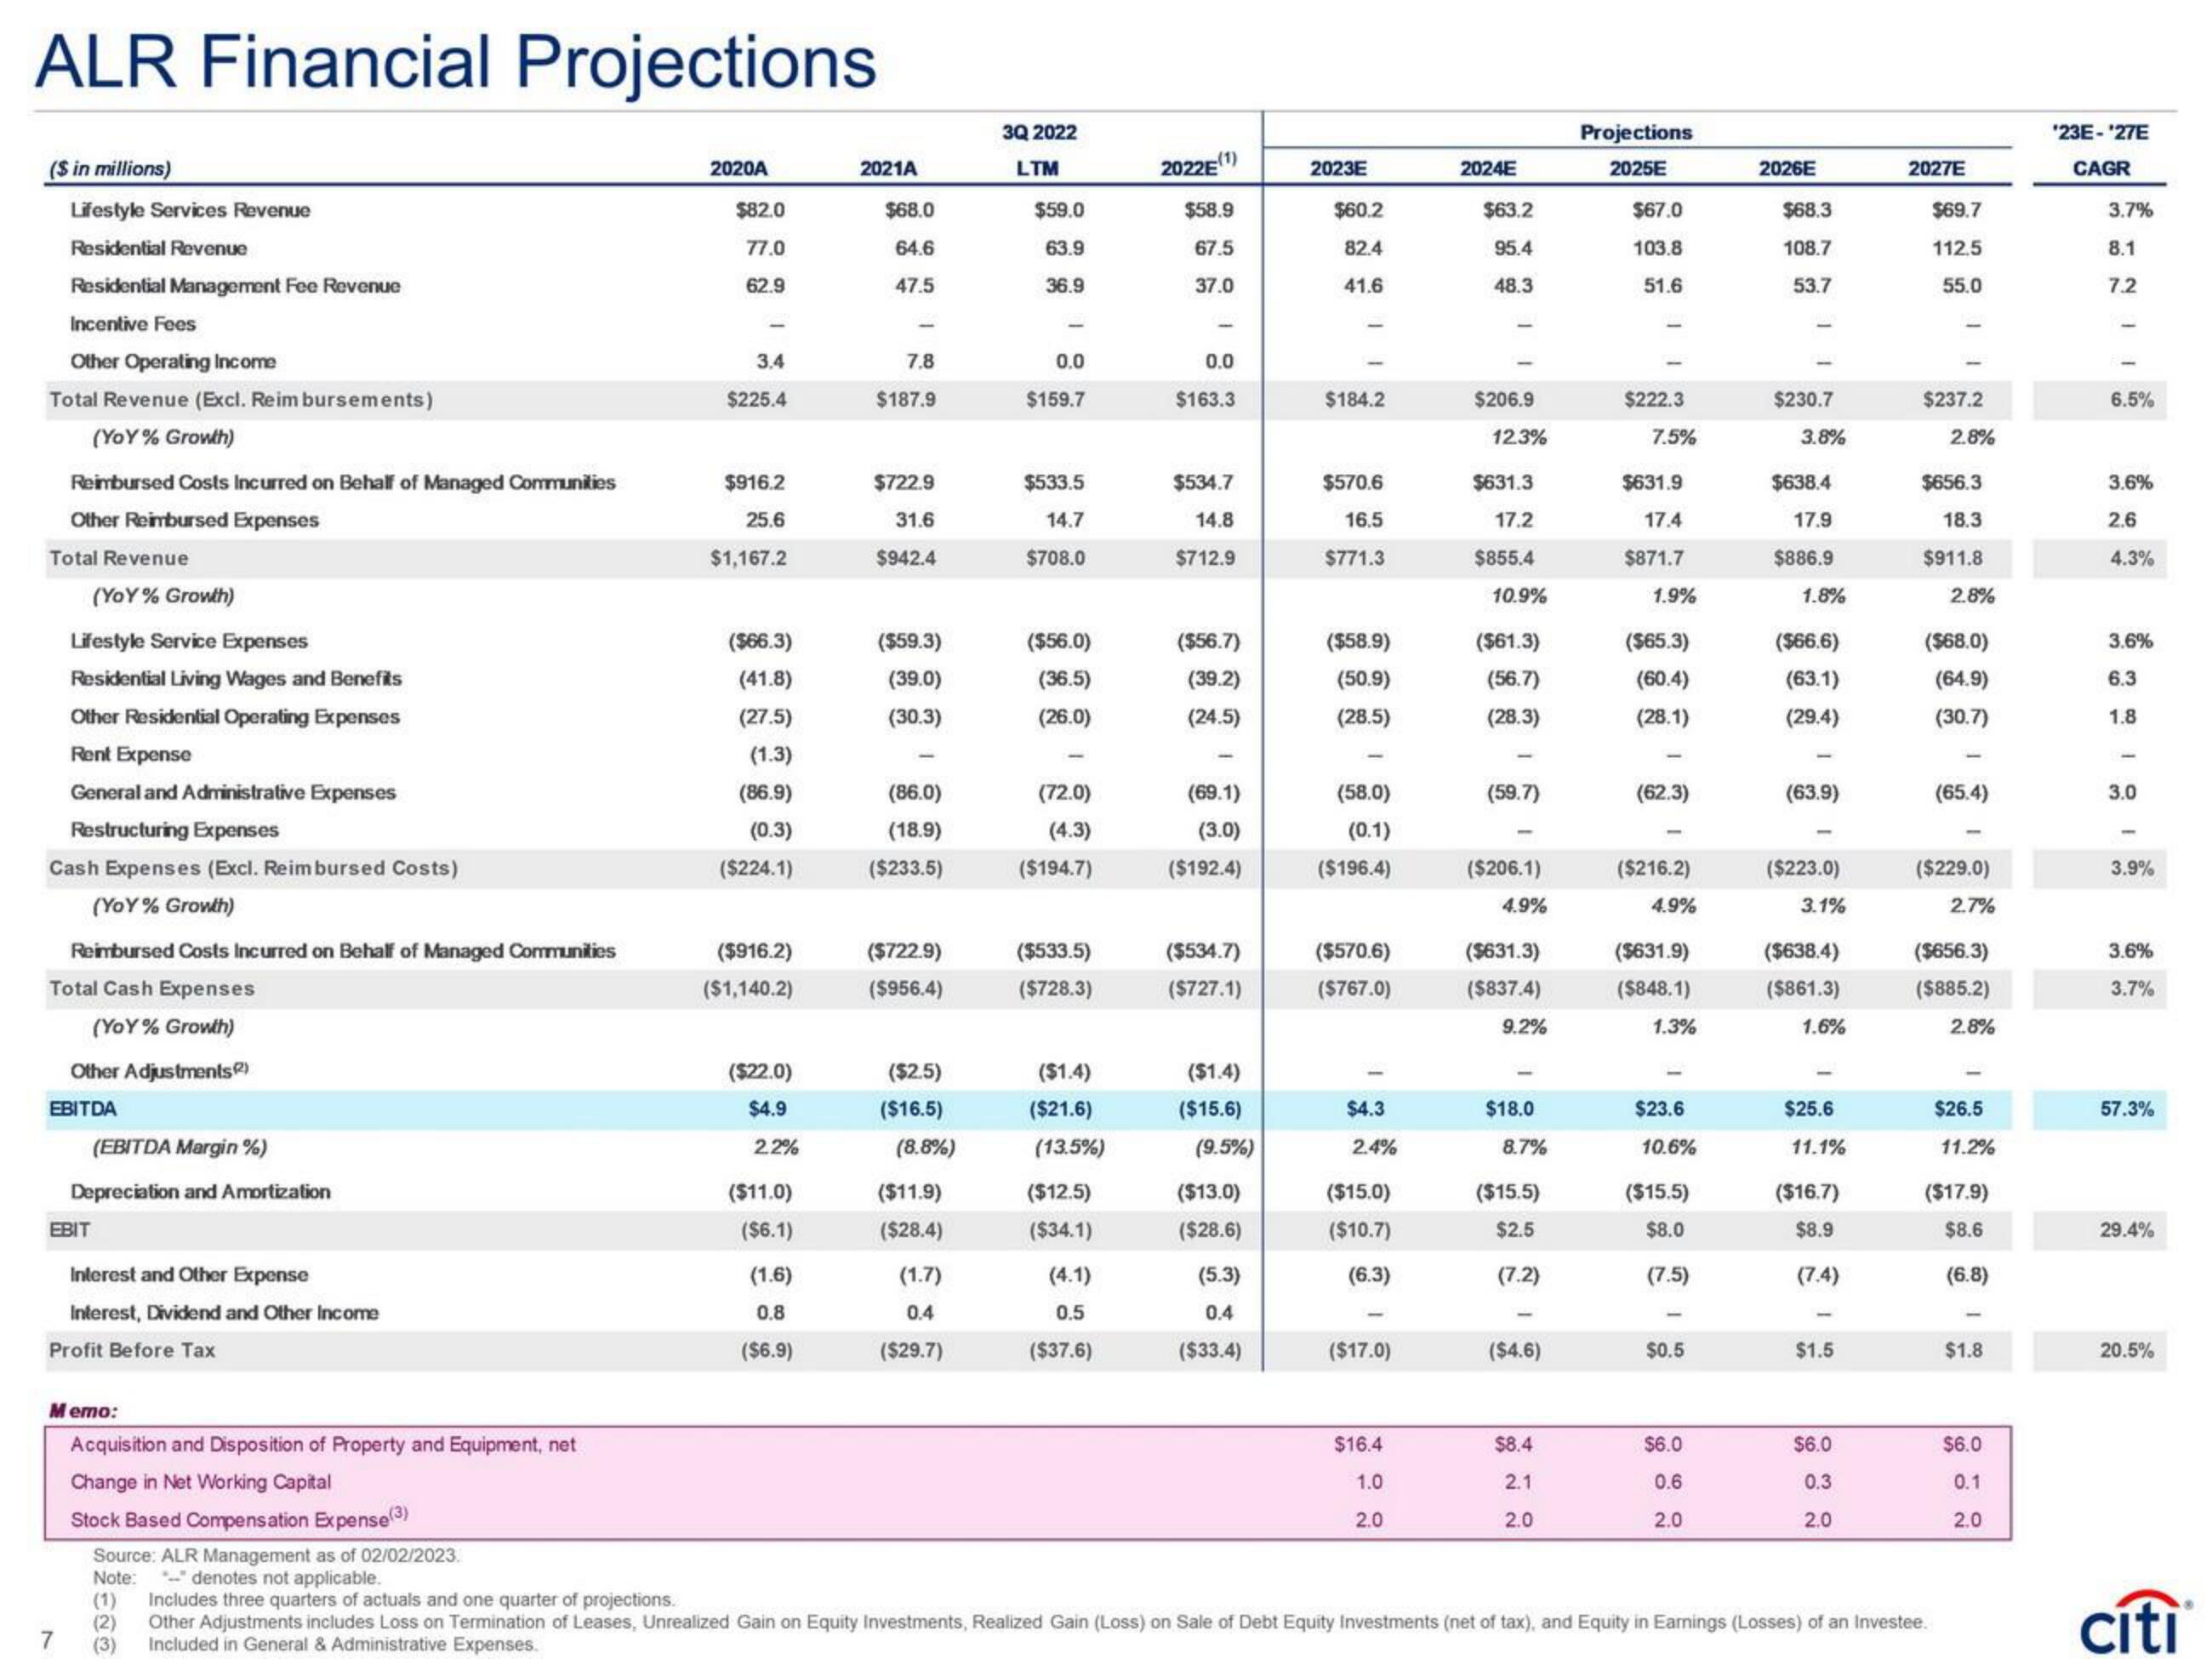
ALR Financial Projections
($ in millions)
Lifestyle Services Revenue
Residential Revenue
Residential Management Fee Revenue
Incentive Fees
Other Operating Income
Total Revenue (Excl. Reimbursements)
(YoY% Growth)
Reimbursed Costs Incurred on Behalf of Managed Communities
Other Reimbursed Expenses
Total Revenue
(Yo Y% Growth)
Lifestyle Service Expenses
Residential Living Wages and Benefits
Other Residential Operating Expenses
Rent Expense
General and Administrative Expenses
Restructuring Expenses
Cash Expenses (Excl. Reimbursed Costs)
(YoY% Growth)
Reimbursed Costs Incurred on Behalf of Managed Communities
Total Cash Expenses
(Yo Y% Growth)
Other Adjustments)
EBITDA
(EBITDA Margin %)
Depreciation and Amortization
EBIT
7
Interest and Other Expense
Interest, Dividend and Other Income
Profit Before Tax
Memo:
Acquisition and Disposition of Property and Equipment, net
Change in Net Working Capital
Stock Based Compensation Expense(3)
Source: ALR Management as of 02/02/2023.
Note:
- denotes not applicable.
2020A
$82.0
77.0
62.9
3.4
$225.4
$916.2
25.6
$1,167.2
($66.3)
(41.8)
(27.5)
(1.3)
(86.9)
(0.3)
($224.1)
($916.2)
($1,140.2)
($22.0)
$4.9
2.2%
($11.0)
($6.1)
(1.6)
0.8
($6.9)
2021A
$68.0
64.6
47.5
7.8
$187.9
$722.9
31.6
$942.4
($59.3)
(39.0)
(30.3)
(86.0)
(18.9)
($233.5)
($722.9)
($956.4)
($2.5)
($16.5)
(8.8%)
($11.9)
($28.4)
(1.7)
0.4
($29.7)
3Q 2022
LTM
$59.0
63.9
36.9
1
0.0
$159.7
$533.5
14.7
$708.0
($56.0)
(36.5)
(26.0)
(72.0)
(4.3)
($194.7)
($533.5)
($728.3)
($1.4)
($21.6)
(13.5%)
($12.5)
($34.1)
(4.1)
0.5
($37.6)
-(1)
2022E
$58.9
67.5
37.0
0.0
$163.3
$534.7
14.8
$712.9
($56.7)
(39.2)
(24.5)
(69.1)
(3.0)
($192.4)
($534.7)
($727.1)
($1.4)
($15.6)
(9.5%)
($13.0)
($28.6)
(5.3)
0.4
($33.4)
2023E
$60.2
82.4
41.6
$184.2
$570.6
16.5
$771.3
($58.9)
(50.9)
(28.5)
(58.0)
(0.1)
($196.4)
($570.6)
($767.0)
$4.3
2.4%
($15.0)
($10.7)
(6.3)
($17.0)
$16.4
1.0
2.0
2024E
$63.2
95.4
48.3
$206.9
12.3%
$631.3
17.2
$855.4
10.9%
($61.3)
(56.7)
(28.3)
(59.7)
($206.1)
4.9%
($631.3)
($837.4)
9.2%
$18.0
8.7%
($15.5)
$2.5
(7.2)
($4.6)
$8.4
2.1
2.0
Projections
2025E
$67.0
103.8
51.6
$222.3
7.5%
$631.9
17.4
$871.7
1.9%
($65.3)
(60.4)
(28.1)
(62.3)
($216.2)
4.9%
($631.9)
($848.1)
1.3%
$23.6
10.6%
($15.5)
$8.0
(7.5)
$0.5
$6.0
0.6
2.0
2026E
$68.3
108.7
53.7
$230.7
3.8%
$638.4
17.9
$886.9
1.8%
($66.6)
(63.1)
(29.4)
(63.9)
($223.0)
3.1%
($638.4)
($861.3)
1.6%
$25.6
11.1%
($16.7)
$8.9
(7.4)
$1.5
$6.0
0.3
2.0
2027E
$69.7
112.5
55.0
$237.2
2.8%
$656.3
18.3
$911.8
2.8%
($68.0)
(64.9)
(30.7)
(65.4)
($229.0)
(1) Includes three quarters of actuals and one quarter of projections.
(2) Other Adjustments includes Loss on Termination of Leases, Unrealized Gain on Equity Investments, Realized Gain (Loss) on Sale of Debt Equity Investments (net of tax), and Equity in Earnings (Losses) of an Investee.
(3) Included in General & Administrative Expenses.
2.7%
($656.3)
($885.2)
2.8%
$26.5
11.2%
($17.9)
$8.6
(6.8)
$1.8
$6.0
0.1
2.0
'23E-'27E
CAGR
3.7%
8.1
7.2
6.5%
3.6%
2.6
4.3%
3.6%
6.3
1.8
3.0
3.9%
3.6%
3.7%
57.3%
29.4%
20.5%
cítiView entire presentation