JD Sports Results Presentation Deck
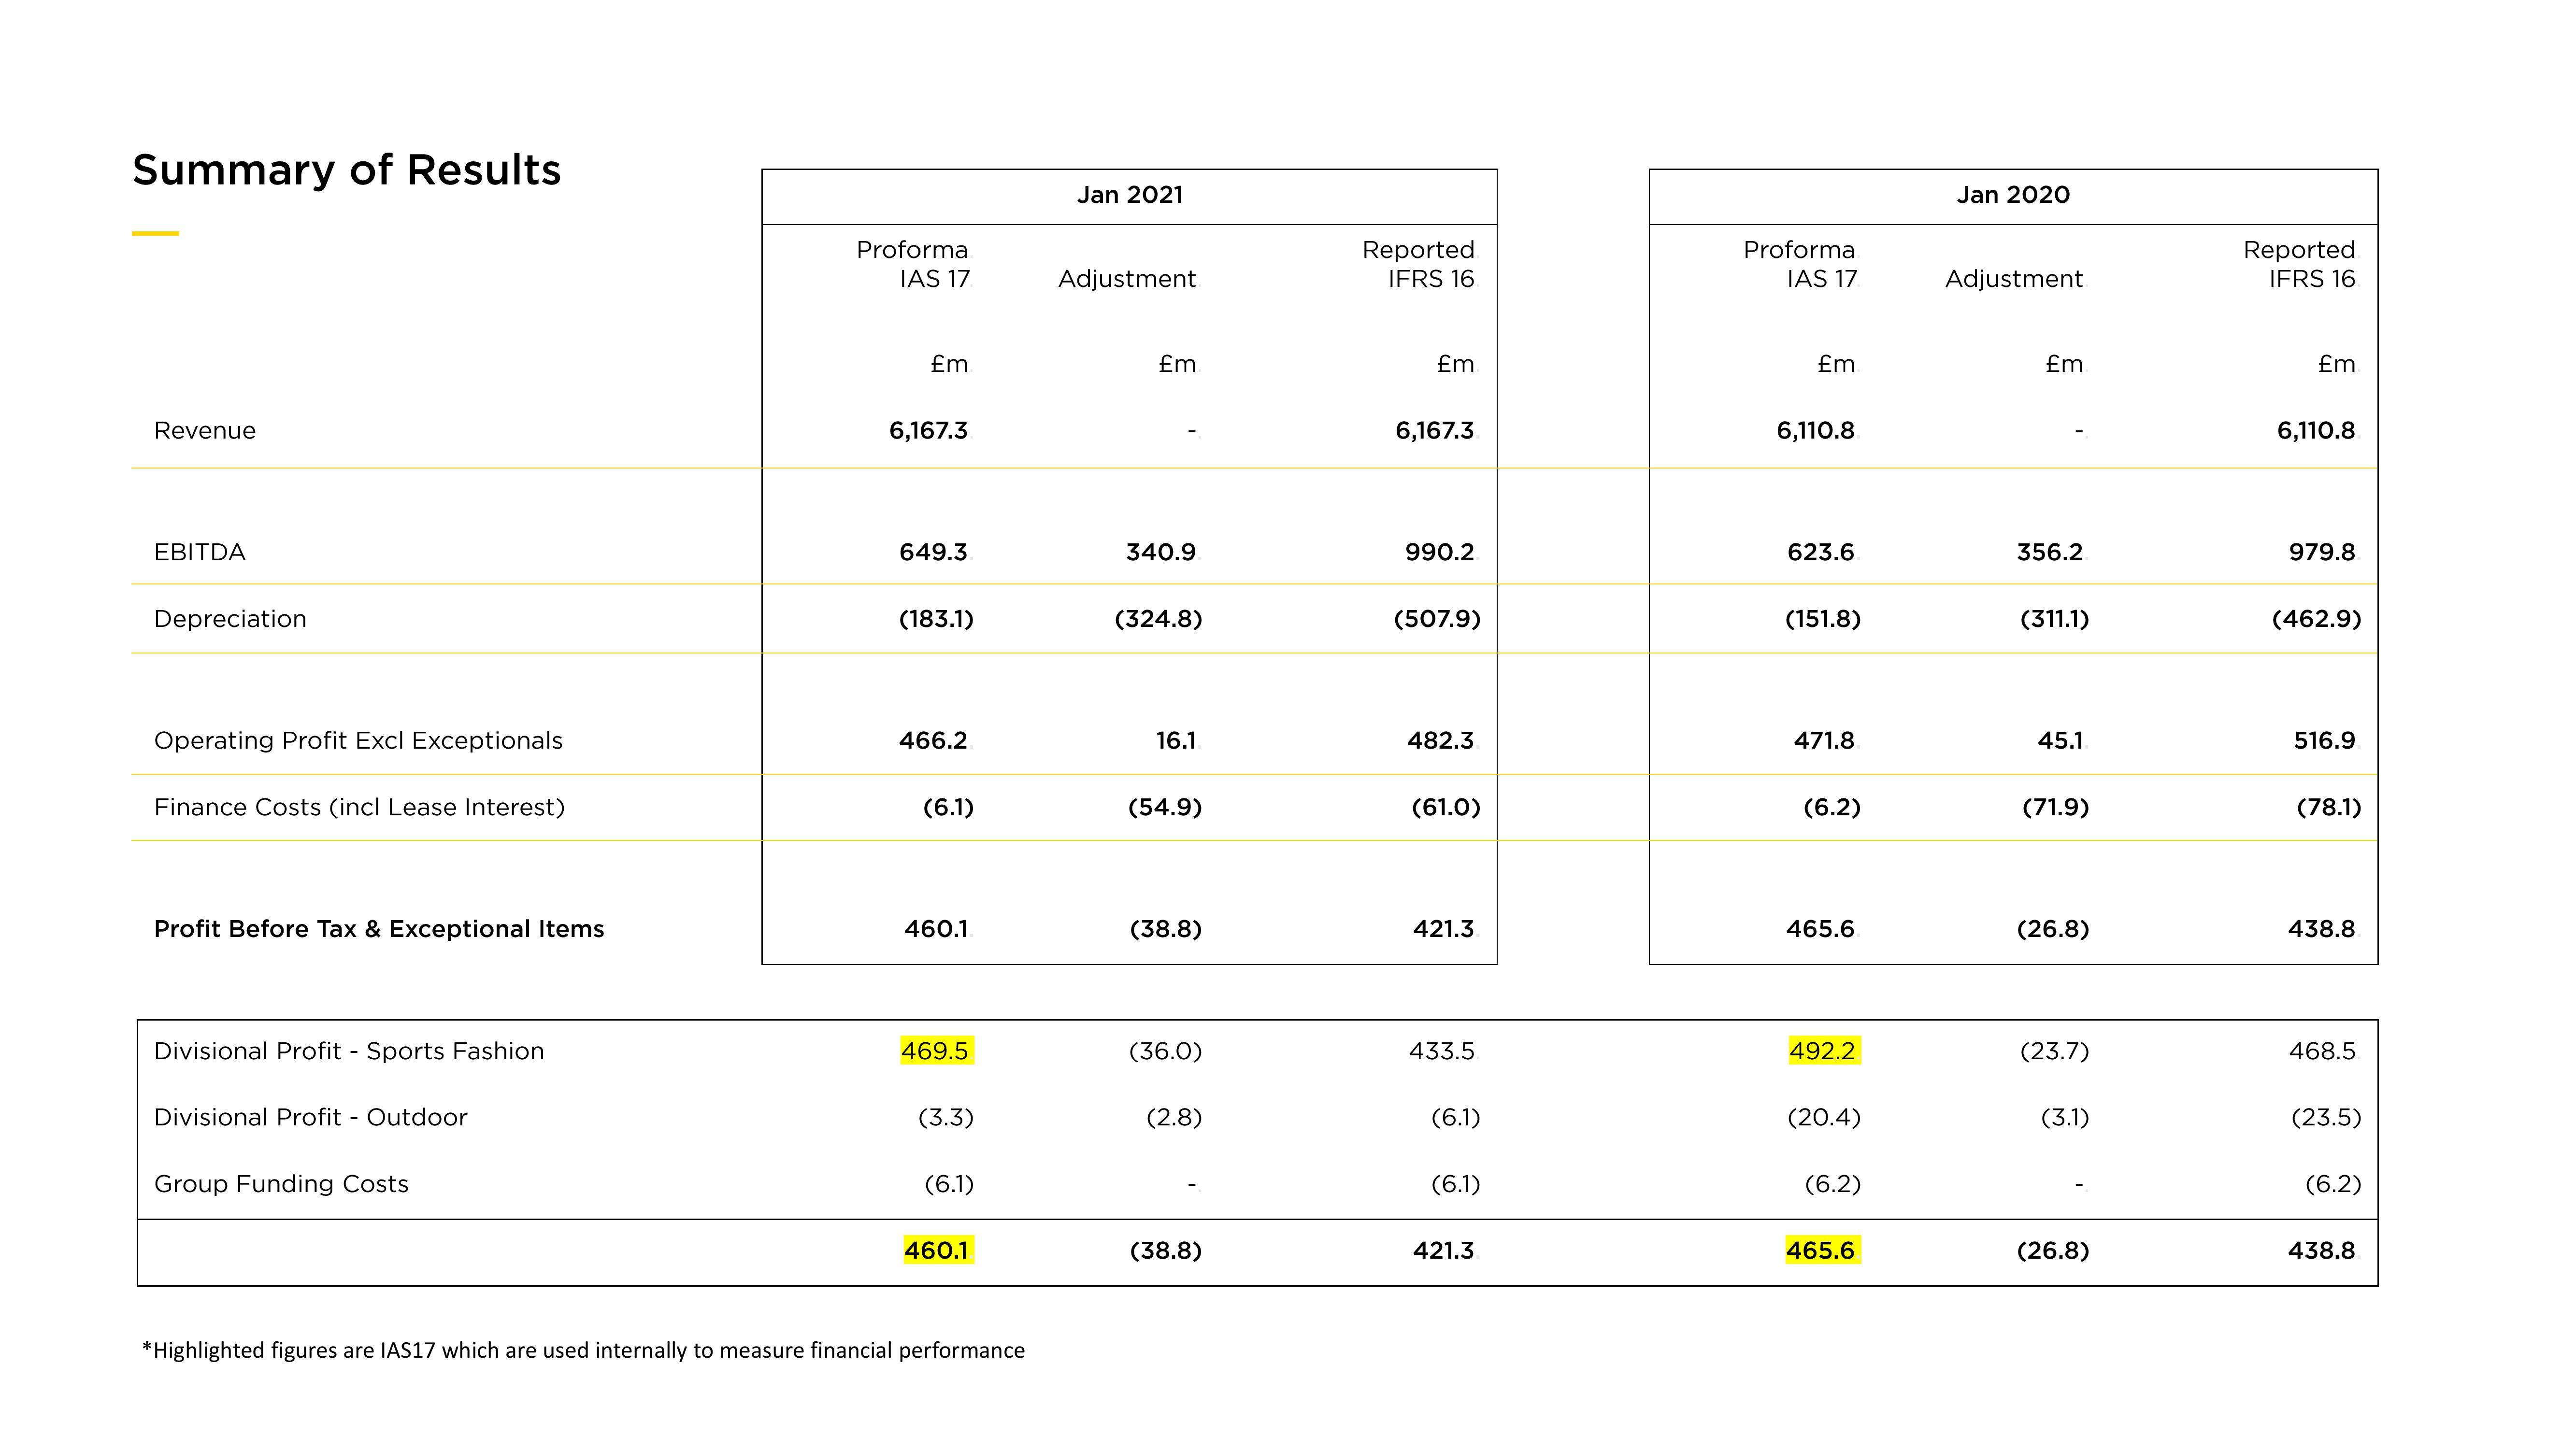
Summary of Results
Revenue
EBITDA
Depreciation
Operating Profit Excl Exceptionals
Finance Costs (incl Lease Interest)
Profit Before Tax & Exceptional Items
Divisional Profit - Sports Fashion
Divisional Profit - Outdoor
Group Funding Costs
Proforma
IAS 17
£m
6,167.3
649.3
(183.1)
466.2
(6.1)
460.1
469.5
(3.3)
(6.1)
460.1
*Highlighted figures are IAS17 which are used internally to measure financial performance
Jan 2021
Adjustment
£m
340.9
(324.8)
16.1
(54.9)
(38.8)
(36.0)
(2.8)
(38.8)
Reported
IFRS 16.
£m
6,167.3
990.2
(507.9)
482.3
(61.0)
421.3
433.5
(6.1)
(6.1)
421.3
Proforma.
IAS 17
£m
6,110.8
623.6
(151.8)
471.8
(6.2)
465.6
492.2
(20.4)
(6.2)
465.6
Jan 2020
Adjustment
£m
356.2
(311.1)
45.1
(71.9)
(26.8)
(23.7)
(3.1)
(26.8)
Reported.
IFRS 16
£m.
6,110.8
979.8
(462.9)
516.9
(78.1)
438.8
468.5
(23.5)
(6.2)
438.8View entire presentation