Main Street Capital Investor Day Presentation Deck
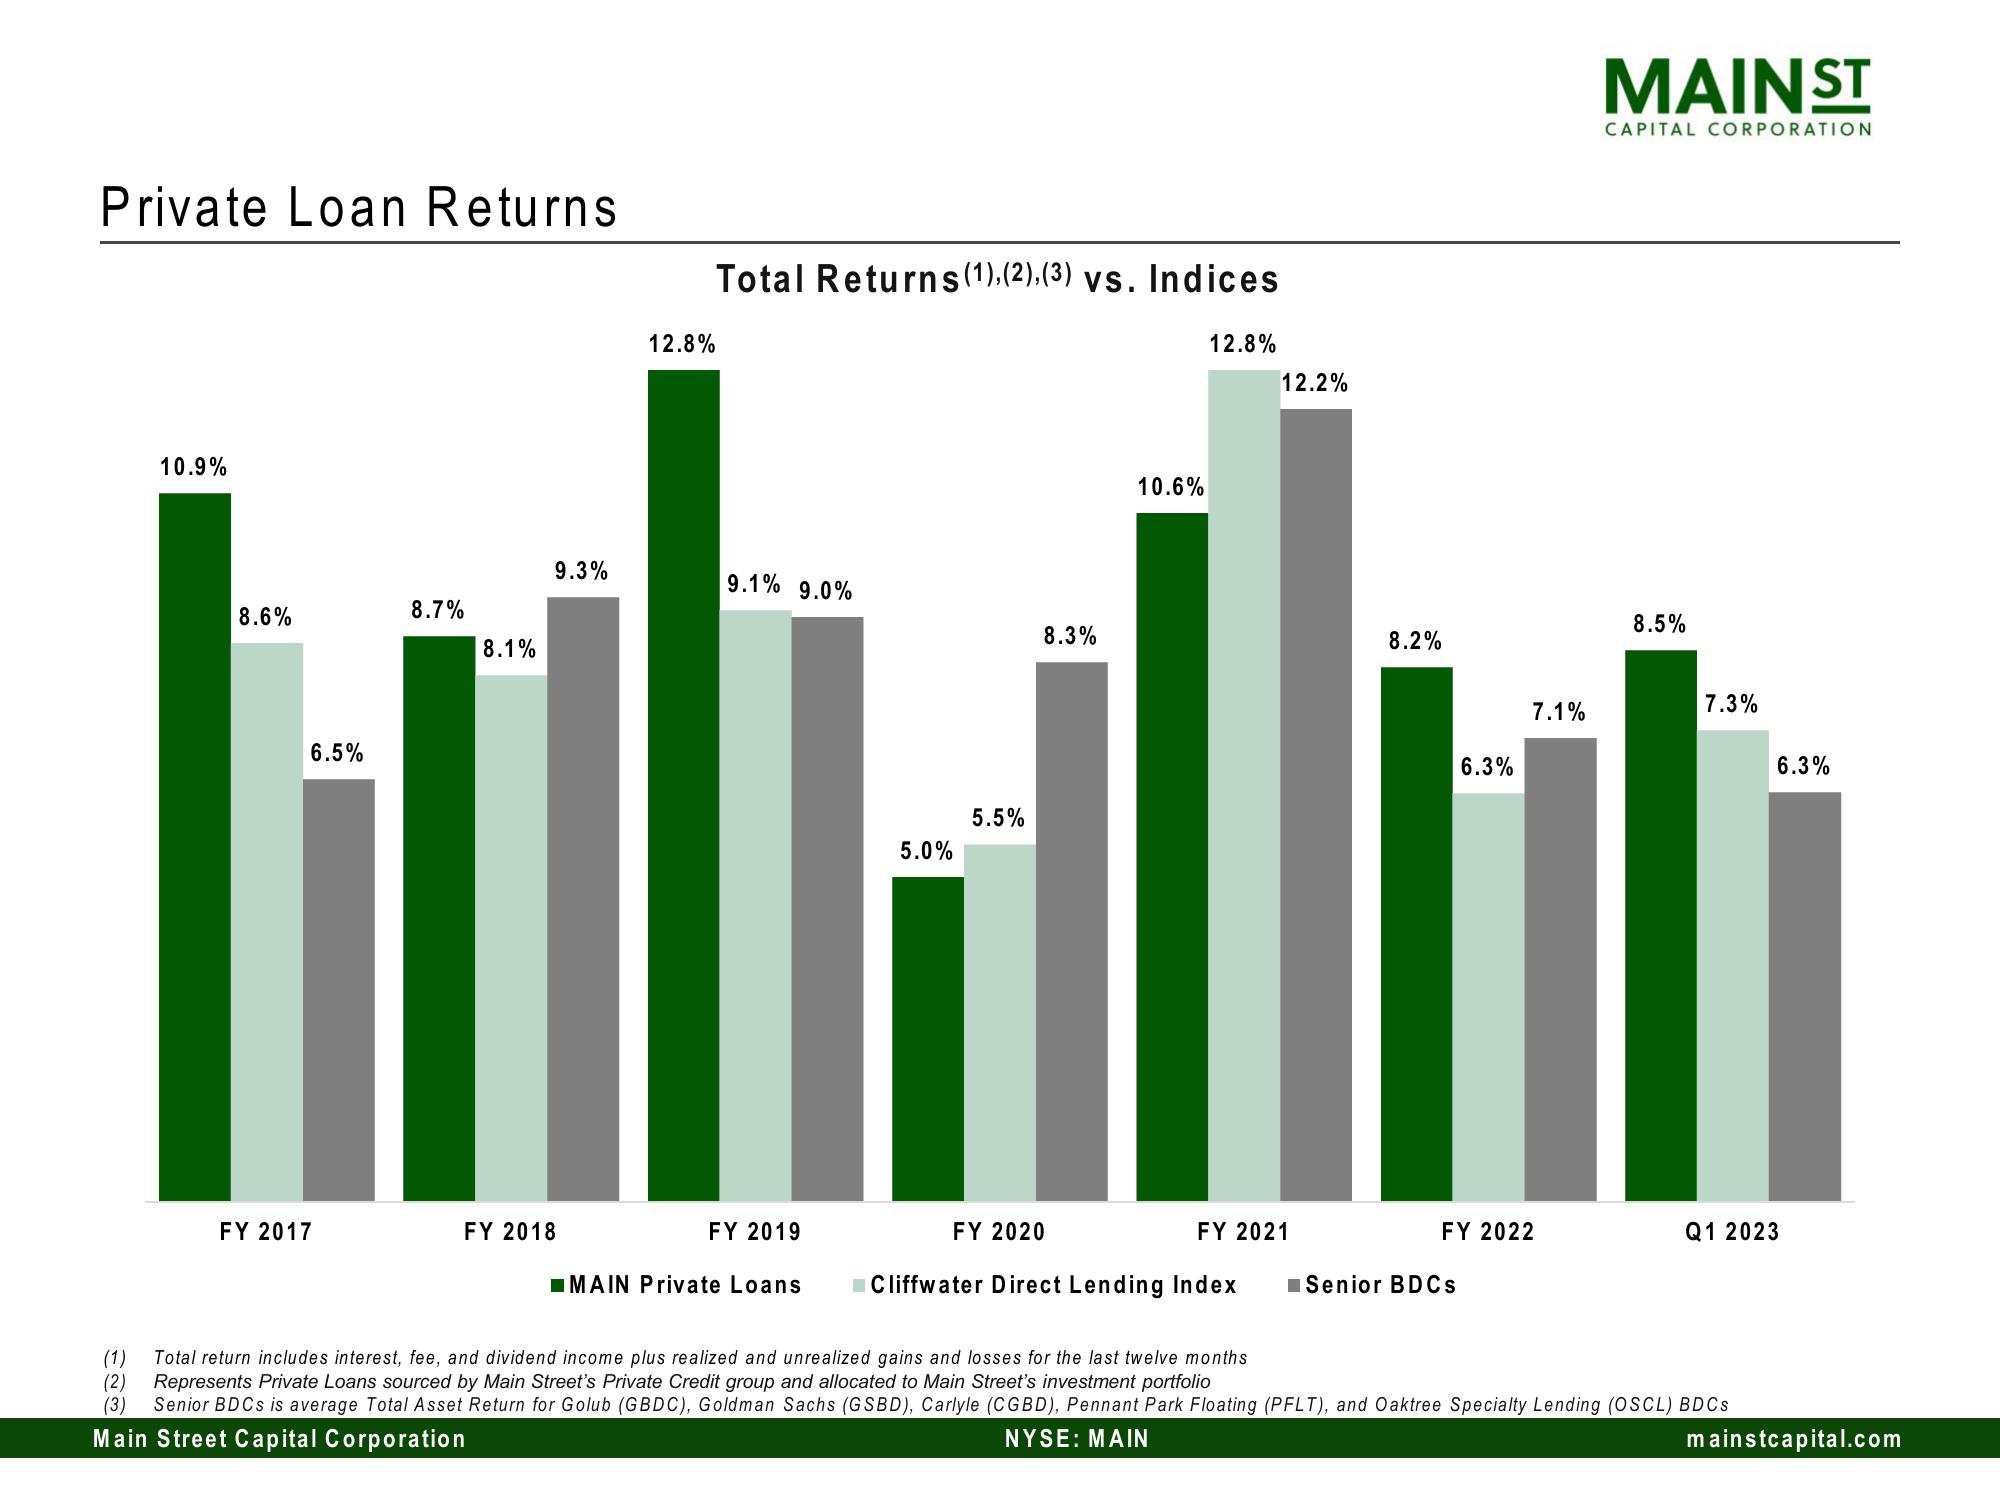
Private Loan Returns
10.9%
8.6%
6.5%
FY 2017
8.7%
8.1%
9.3%
FY 2018
12.8%
Total Returns (1), (2), (3) vs. Indices
9.1% 9.0%
FY 2019
■MAIN Private Loans
5.0%
5.5%
8.3%
10.6%
12.8%
FY 2020
Cliffwater Direct Lending Index
12.2%
FY 2021
8.2%
6.3%
Senior BDCs
7.1%
FY 2022
MAIN ST
CAPITAL CORPORATION
8.5%
7.3%
6.3%
Q1 2023
(1) Total return includes interest, fee, and dividend income plus realized and unrealized gains and losses for the last twelve months
(2) Represents Private Loans sourced by Main Street's Private Credit group and allocated to Main Street's investment portfolio
(3) Senior BDCs is average Total Asset Return for Golub (GBDC), Goldman Sachs (GSBD), Carlyle (CGBD), Pennant Park Floating (PFLT), and Oaktree Specialty Lending (OSCL) BDCS
Main Street Capital Corporation
NYSE: MAIN
mainstcapital.comView entire presentation