First Merchants Results Presentation Deck
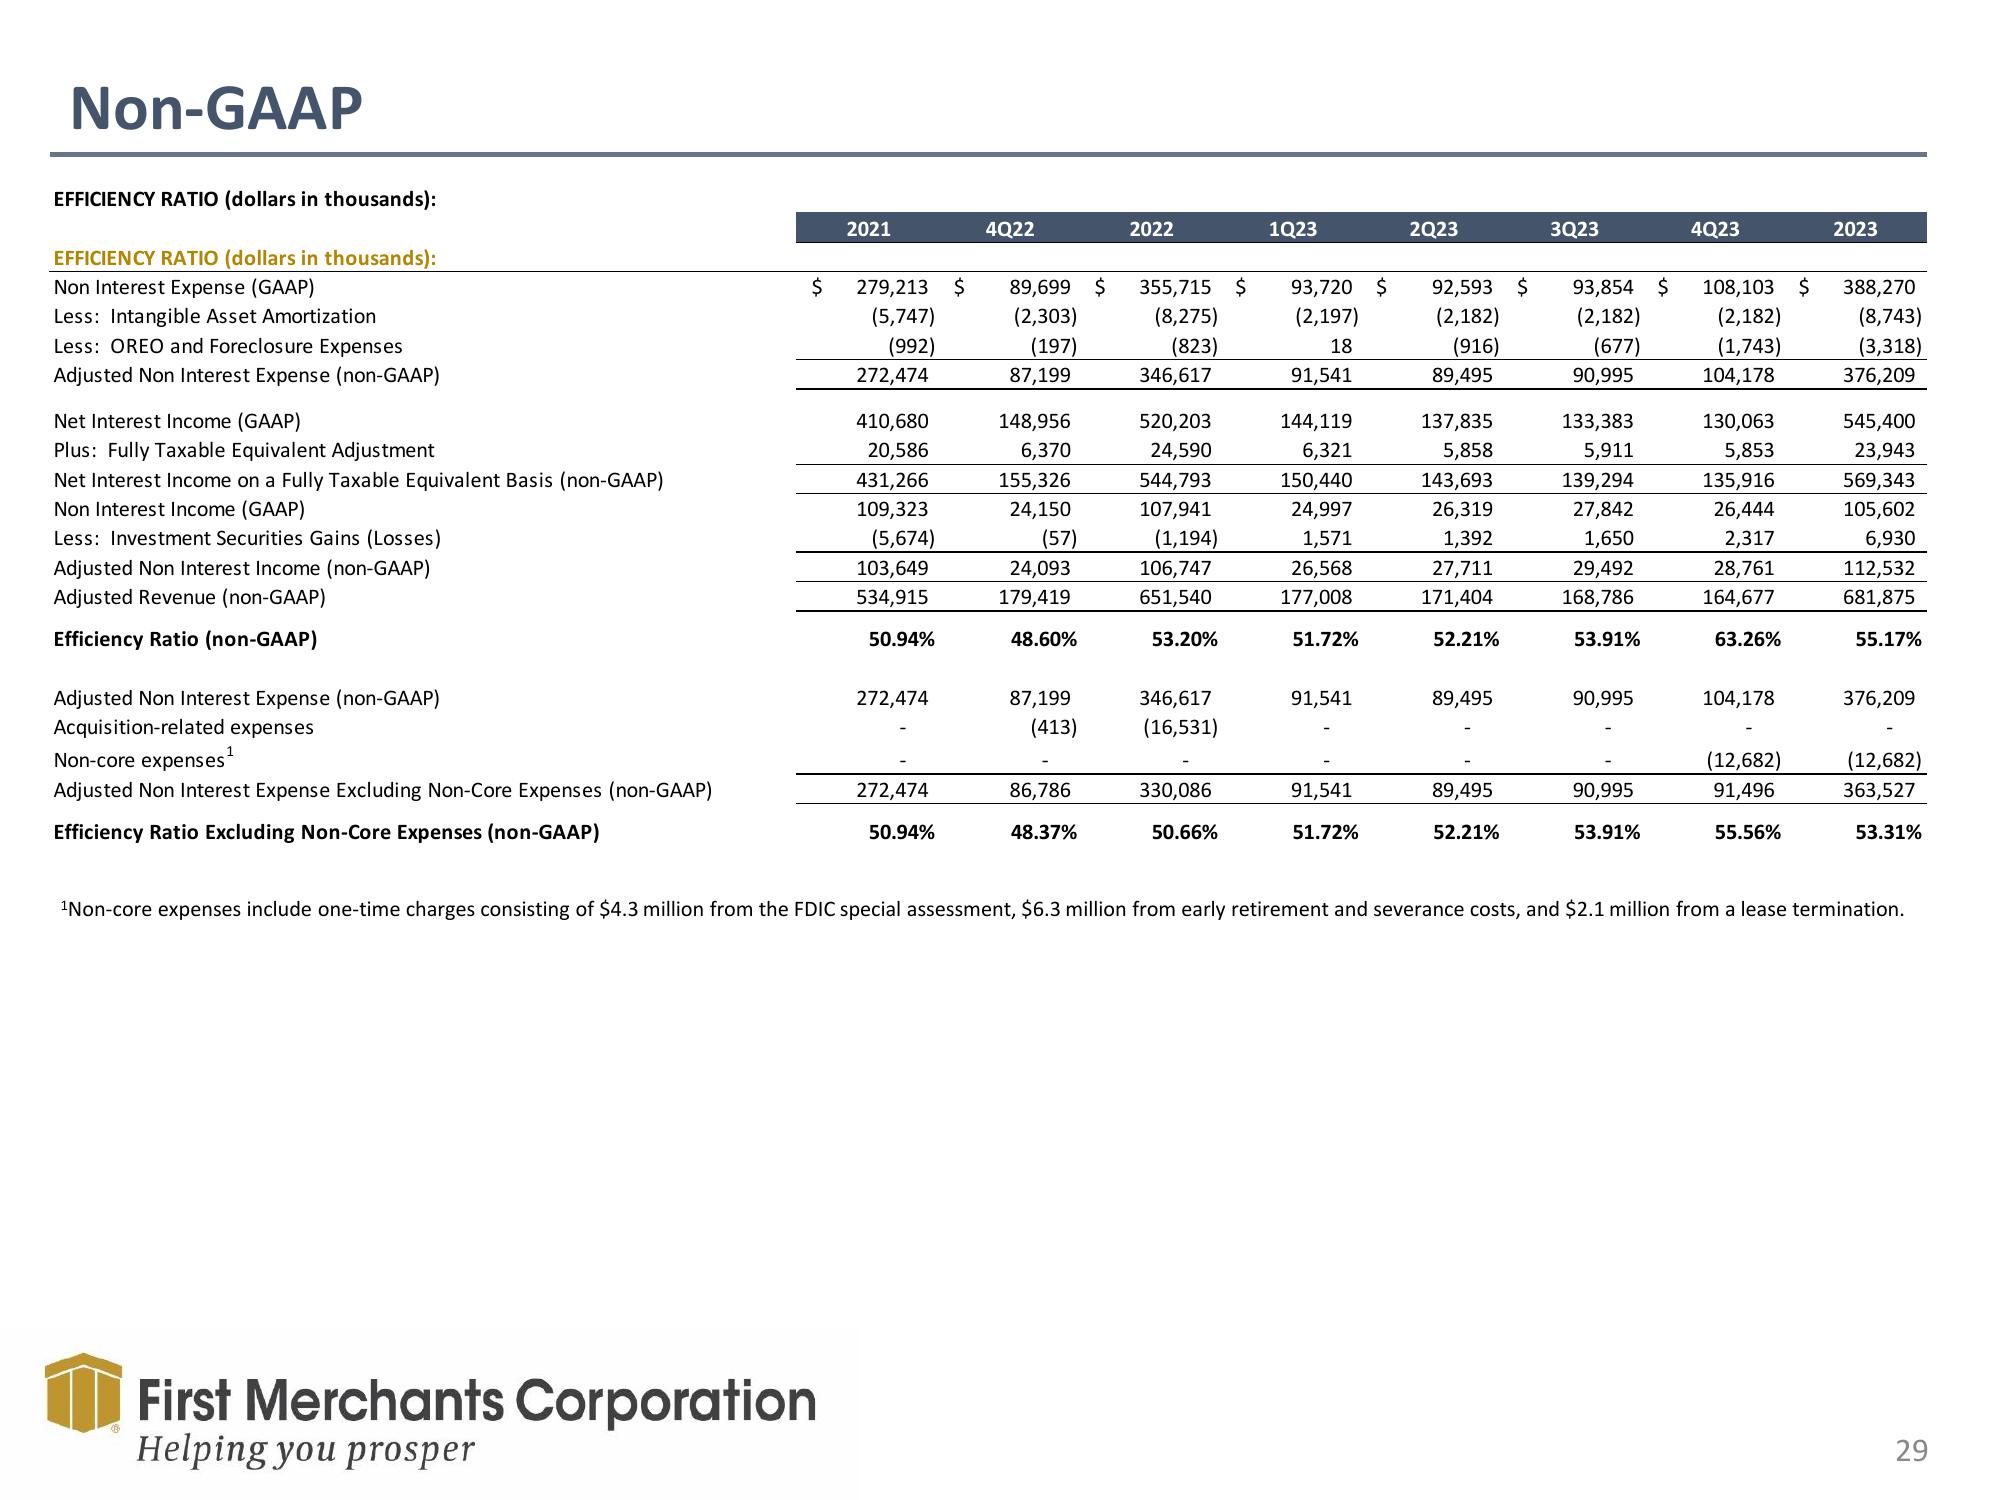
Non-GAAP
EFFICIENCY RATIO (dollars in thousands):
EFFICIENCY RATIO (dollars in thousands):
Non Interest Expense (GAAP)
Less: Intangible Asset Amortization
Less: OREO and Foreclosure Expenses
Adjusted Non Interest Expense (non-GAAP)
Net Interest Income (GAAP)
Plus: Fully Taxable Equivalent Adjustment
Net Interest Income on a Fully Taxable Equivalent Basis (non-GAAP)
Non Interest Income (GAAP)
Less: Investment Securities Gains (Losses)
Adjusted Non Interest Income (non-GAAP)
Adjusted Revenue (non-GAAP)
Efficiency Ratio (non-GAAP)
Adjusted Non Interest Expense (non-GAAP)
Acquisition-related expenses
Non-core expenses ¹
1
Adjusted Non Interest Expense Excluding Non-Core Expenses (non-GAAP)
Efficiency Ratio Excluding Non-Core Expenses (non-GAAP)
2021
$ 279,213 $
(5,747)
(992)
First Merchants Corporation
Helping you prosper
272,474
410,680
20,586
431,266
109,323
(5,674)
103,649
534,915
50.94%
272,474
272,474
50.94%
4Q22
89,699 $
(2,303)
(197)
87,199
148,956
6,370
155,326
24,150
(57)
24,093
179,419
48.60%
87,199
(413)
86,786
48.37%
2022
355,715
(8,275)
(823)
346,617
520,203
24,590
544,793
107,941
(1,194)
106,747
651,540
53.20%
346,617
(16,531)
330,086
50.66%
$
1Q23
93,720 $
(2,197)
18
91,541
144,119
6,321
150,440
24,997
1,571
26,568
177,008
51.72%
91,541
91,541
51.72%
2023
92,593 $
(2,182)
(916)
89,495
137,835
5,858
143,693
26,319
1,392
27,711
171,404
52.21%
89,495
89,495
52.21%
3Q23
93,854 $
(2,182)
(677)
90,995
133,383
5,911
139,294
27,842
1,650
29,492
168,786
53.91%
90,995
90,995
53.91%
4Q23
108,103 $
(2,182)
(1,743)
104,178
130,063
5,853
135,916
26,444
2,317
28,761
164,677
63.26%
104,178
(12,682)
91,496
55.56%
2023
388,270
(8,743)
(3,318)
376,209
545,400
23,943
569,343
105,602
6,930
112,532
681,875
55.17%
376,209
(12,682)
363,527
53.31%
¹Non-core expenses include one-time charges consisting of $4.3 million from the FDIC special assessment, $6.3 million from early retirement and severance costs, and $2.1 million from a lease termination.
29View entire presentation