Nikola Results Presentation Deck
PAGE
NIKOLA
FINANCIAL OVERVIEW
In Thousands
Except Share and per Share Data
Solar revenues (1)
123
Cost of solar revenues
Gross profit
Operating expenses:
Research and development
Selling, general, and administrative
Total operating expenses
Loss from operations
Interest income (expense), net
Loss on forward contract liability.
Revaluation of warrant liability
Other income, net
Loss before income taxes and equity in net loss of affiliate
Income tax expense
Loss before equity in net loss of affiliate
Equity in net loss of affiliate
Net loss.
Net loss per share, basic
Net loss per share, diluted (2)
Weighted-average shares outstanding, basic
Weighted-average shares outstanding, diluted (3)
SOGE
Q1 2021
ΤΑ
$-
$
55,163
65,427
$120,590
($120,590)
(9)
951
219
(119,429)
1
(119,430)
(794)
($120,224)
($0.31)
($0.31)
392,189,851
392,489,761
Q1 2020
$58
43
$15
24,077
7,935
$32,012
($31,997)
62
(1,324)
114
(33,145)
1
(33,146)
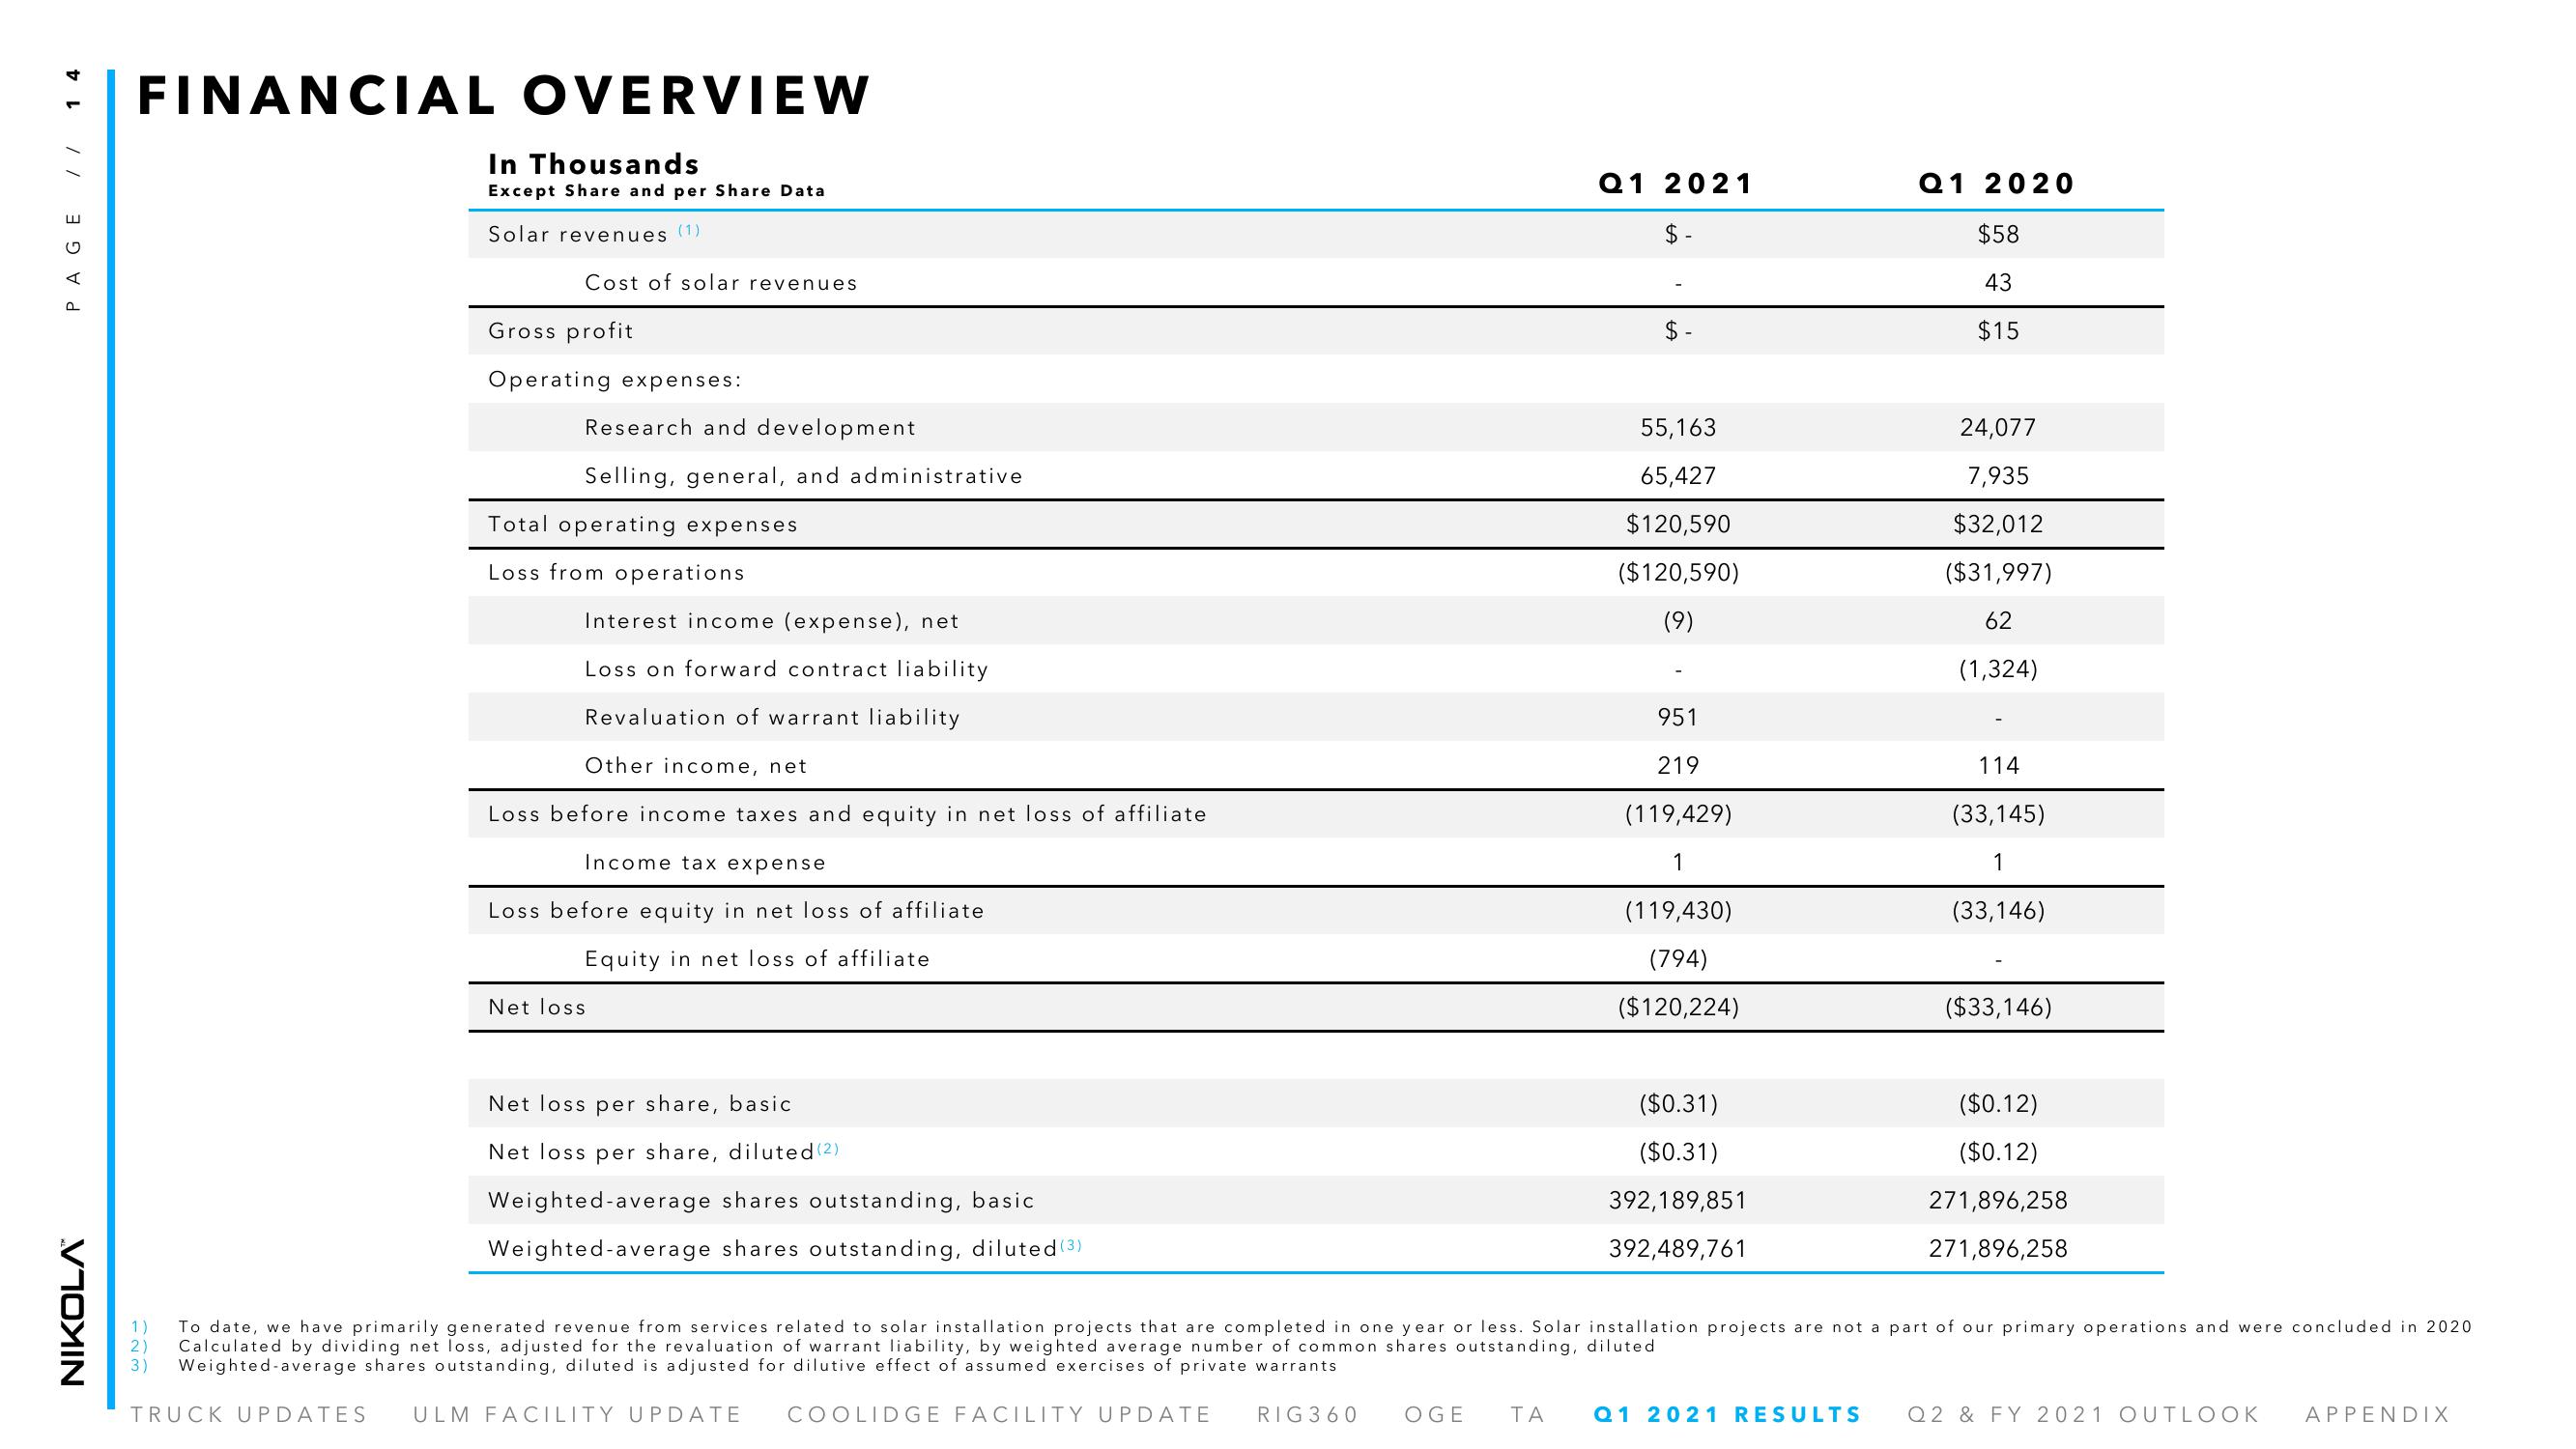
To date, we have primarily generated revenue from services related to solar installation projects that are completed in one year or less. Solar installation projects are not a part of our primary operations and were concluded in 2020
Calculated by dividing net loss, adjusted for the revaluation of warrant liability, by weighted average number of common shares outstanding, diluted
Weighted average shares outstanding, diluted is adjusted for dilutive effect of assumed exercises of private warrants
TRUCK UPDATES ULM FACILITY UPDATE COOLIDGE FACILITY UPDATE RIG360
($33,146)
($0.12)
($0.12)
271,896,258
271,896,258
Q1 2021 RESULTS Q2 & FY 2021 OUTLOOK
APPENDIXView entire presentation