Ashtead Group Results Presentation Deck
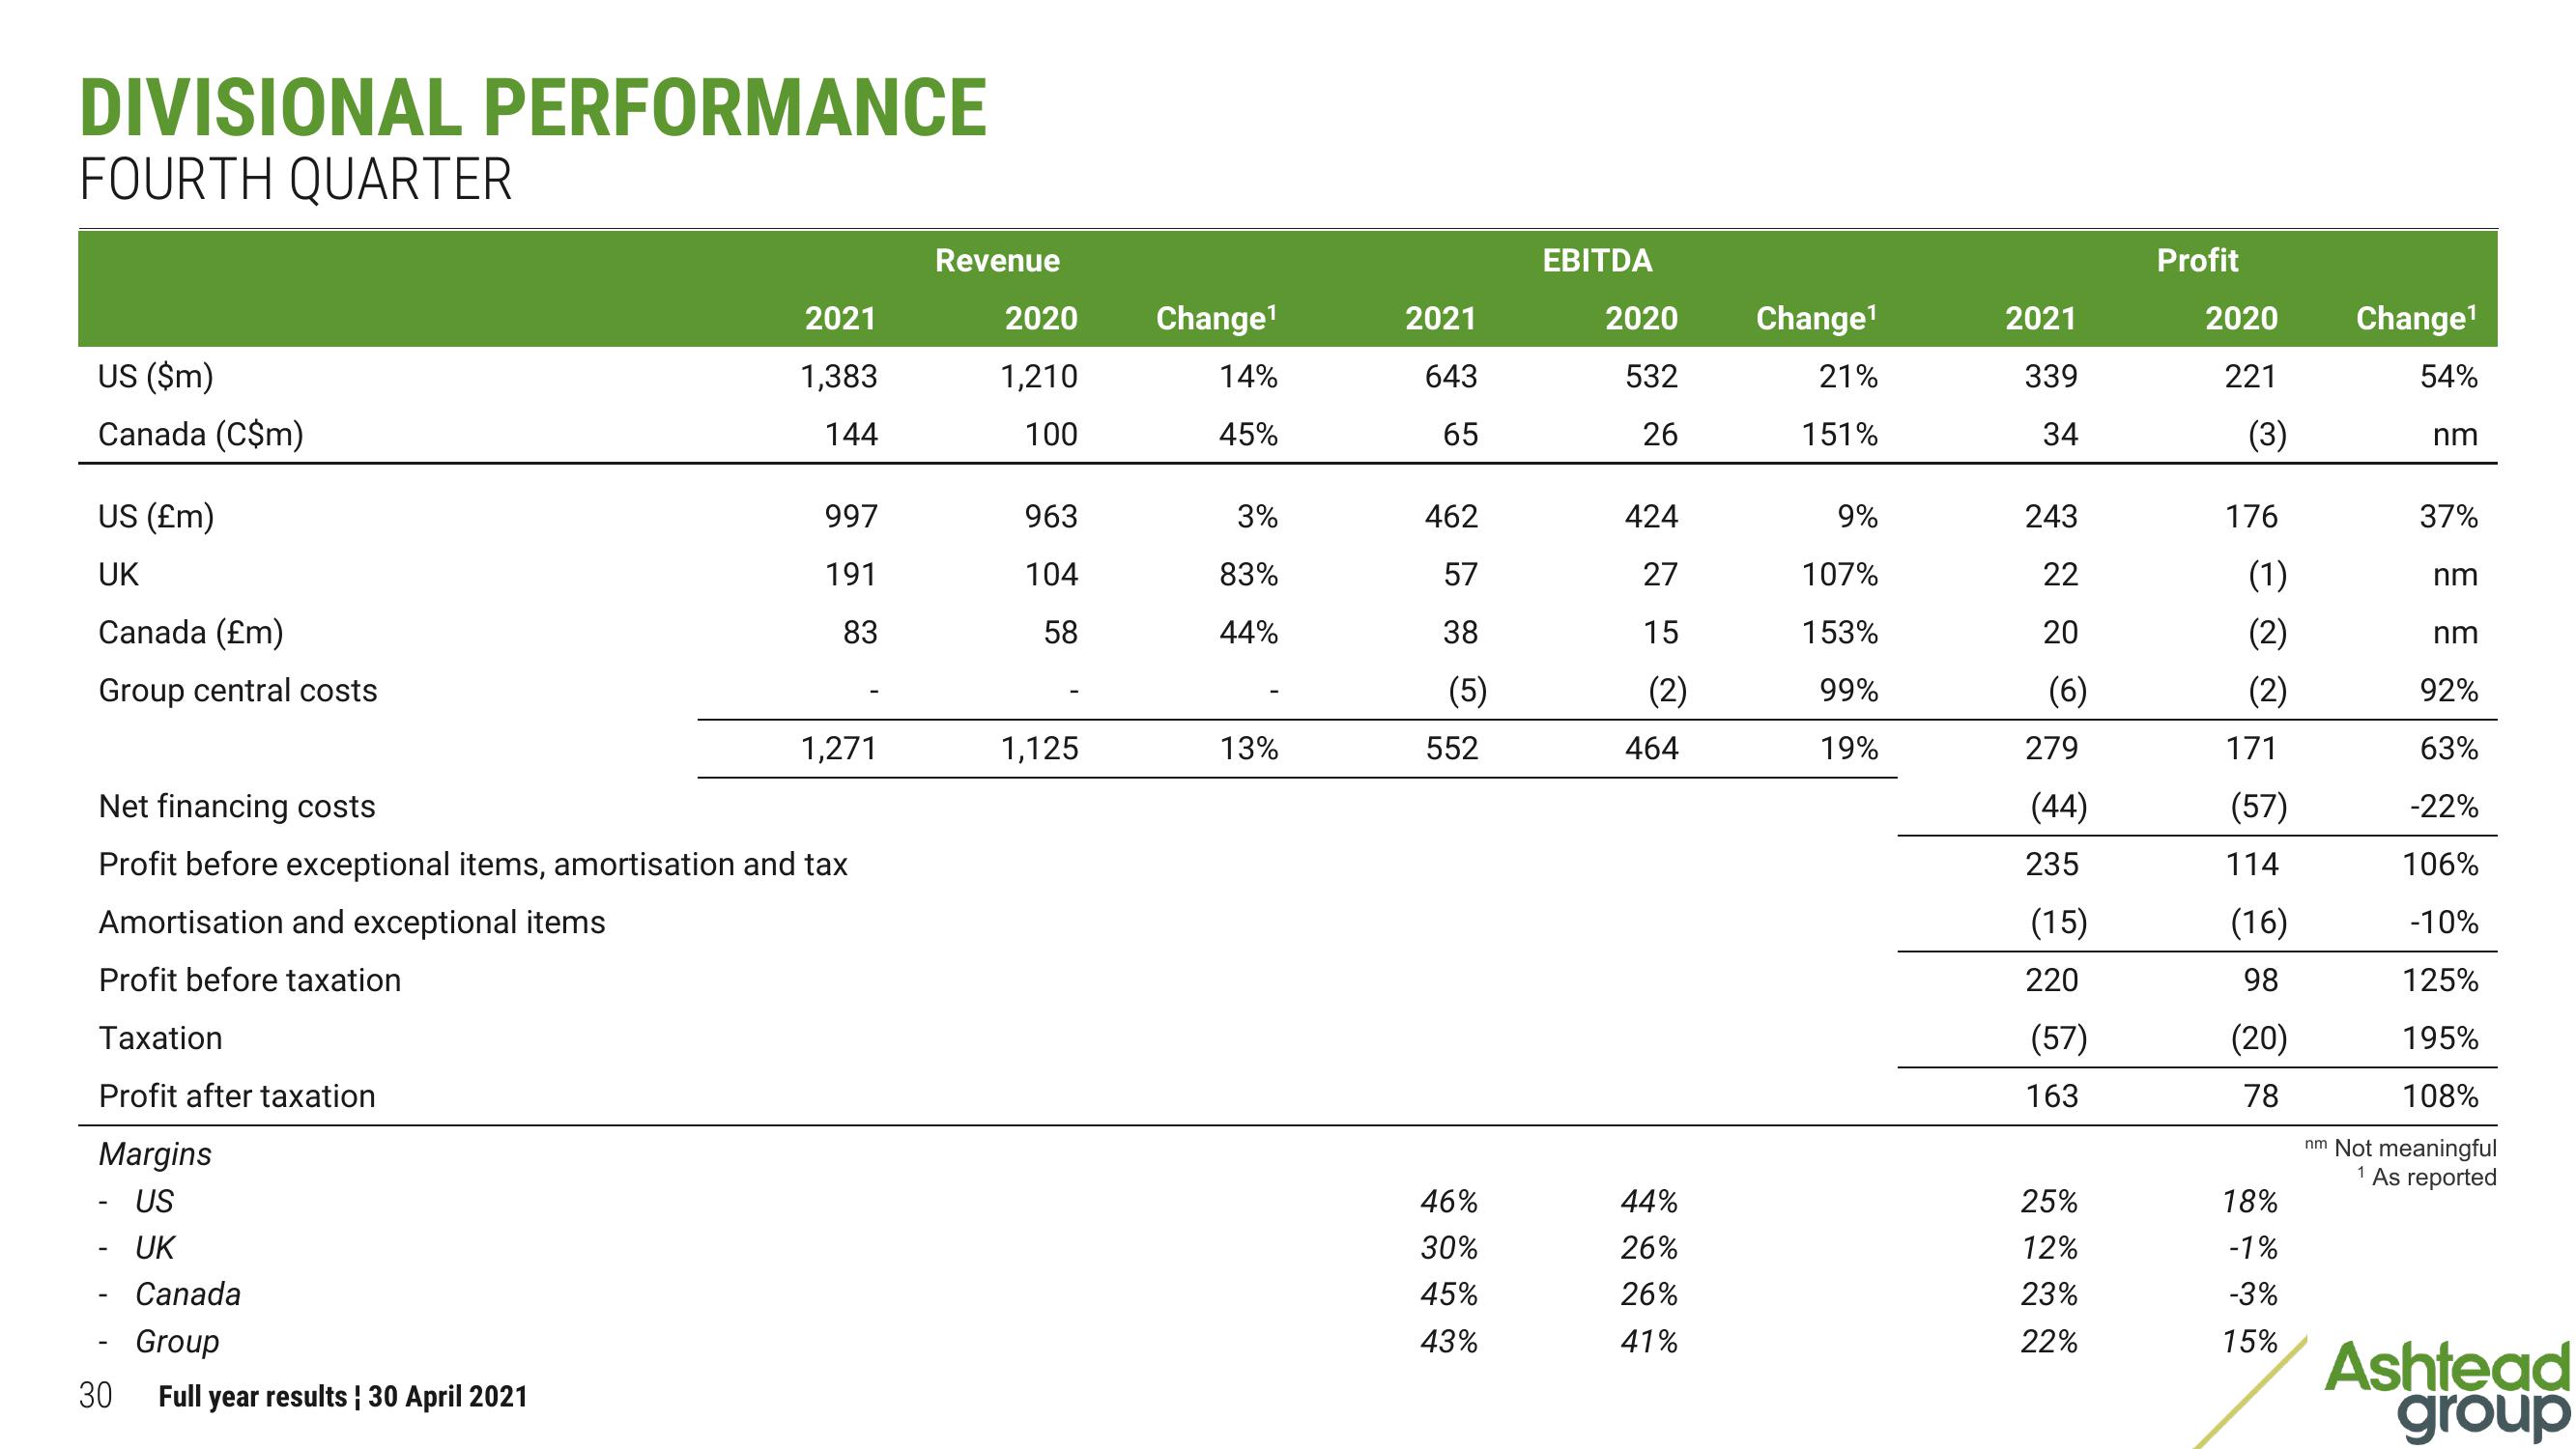
DIVISIONAL PERFORMANCE
FOURTH QUARTER
US ($m)
Canada (C$m)
US (£m)
UK
Canada (£m)
Group central costs
Amortisation and exceptional items
Profit before taxation
Taxation
Profit after taxation
Margins
- US
UK
30
2021
1,383
144
Net financing costs
Profit before exceptional items, amortisation and tax
Canada
Group
Full year results ¦ 30 April 2021
997
191
83
1,271
Revenue
2020
1,210
100
963
104
58
1,125
Change¹
14%
45%
3%
83%
44%
13%
2021
643
65
462
57
38
(5)
552
46%
30%
45%
43%
EBITDA
2020
532
26
424
27
15
(2)
464
44%
26%
26%
41%
Change¹
21%
151%
9%
107%
153%
99%
19%
2021
339
34
243
22
20
(6)
279
(44)
235
(15)
220
(57)
163
25%
12%
23%
22%
Profit
2020
221
(3)
176
(1)
(2)
(2)
171
(57)
114
(16)
98
(20)
78
18%
-1%
-3%
15%
Change¹
54%
nm
37%
nm
nm
92%
63%
-22%
106%
-10%
125%
195%
108%
nm Not meaningful
1 As reported
Ashtead
groupView entire presentation