Bed Bath & Beyond Results Presentation Deck
Q2 2019
P&L Summary
(amounts in millions, except
comp%, % of sales,
and per share data)
77
Comp Sales %
Net Sales
Gross Profit
SG&A Expenses
Operating Profit
Net Earnings
EPS - Diluted
WAS Diluted
Adjusted
August 31, 2019
$2,719
921
858
62
42
$0.34
123
% of Sales
(6.7)
100.0
33.9
31.6
2.3
1.5
Three Months Ended
(b)
Adjusted
September 1, 2018 % of Sales
(0.6)
$2,935
989
905
83
52
$0.38
136
100.0
33.7
30.8
2.8
1.8
Change
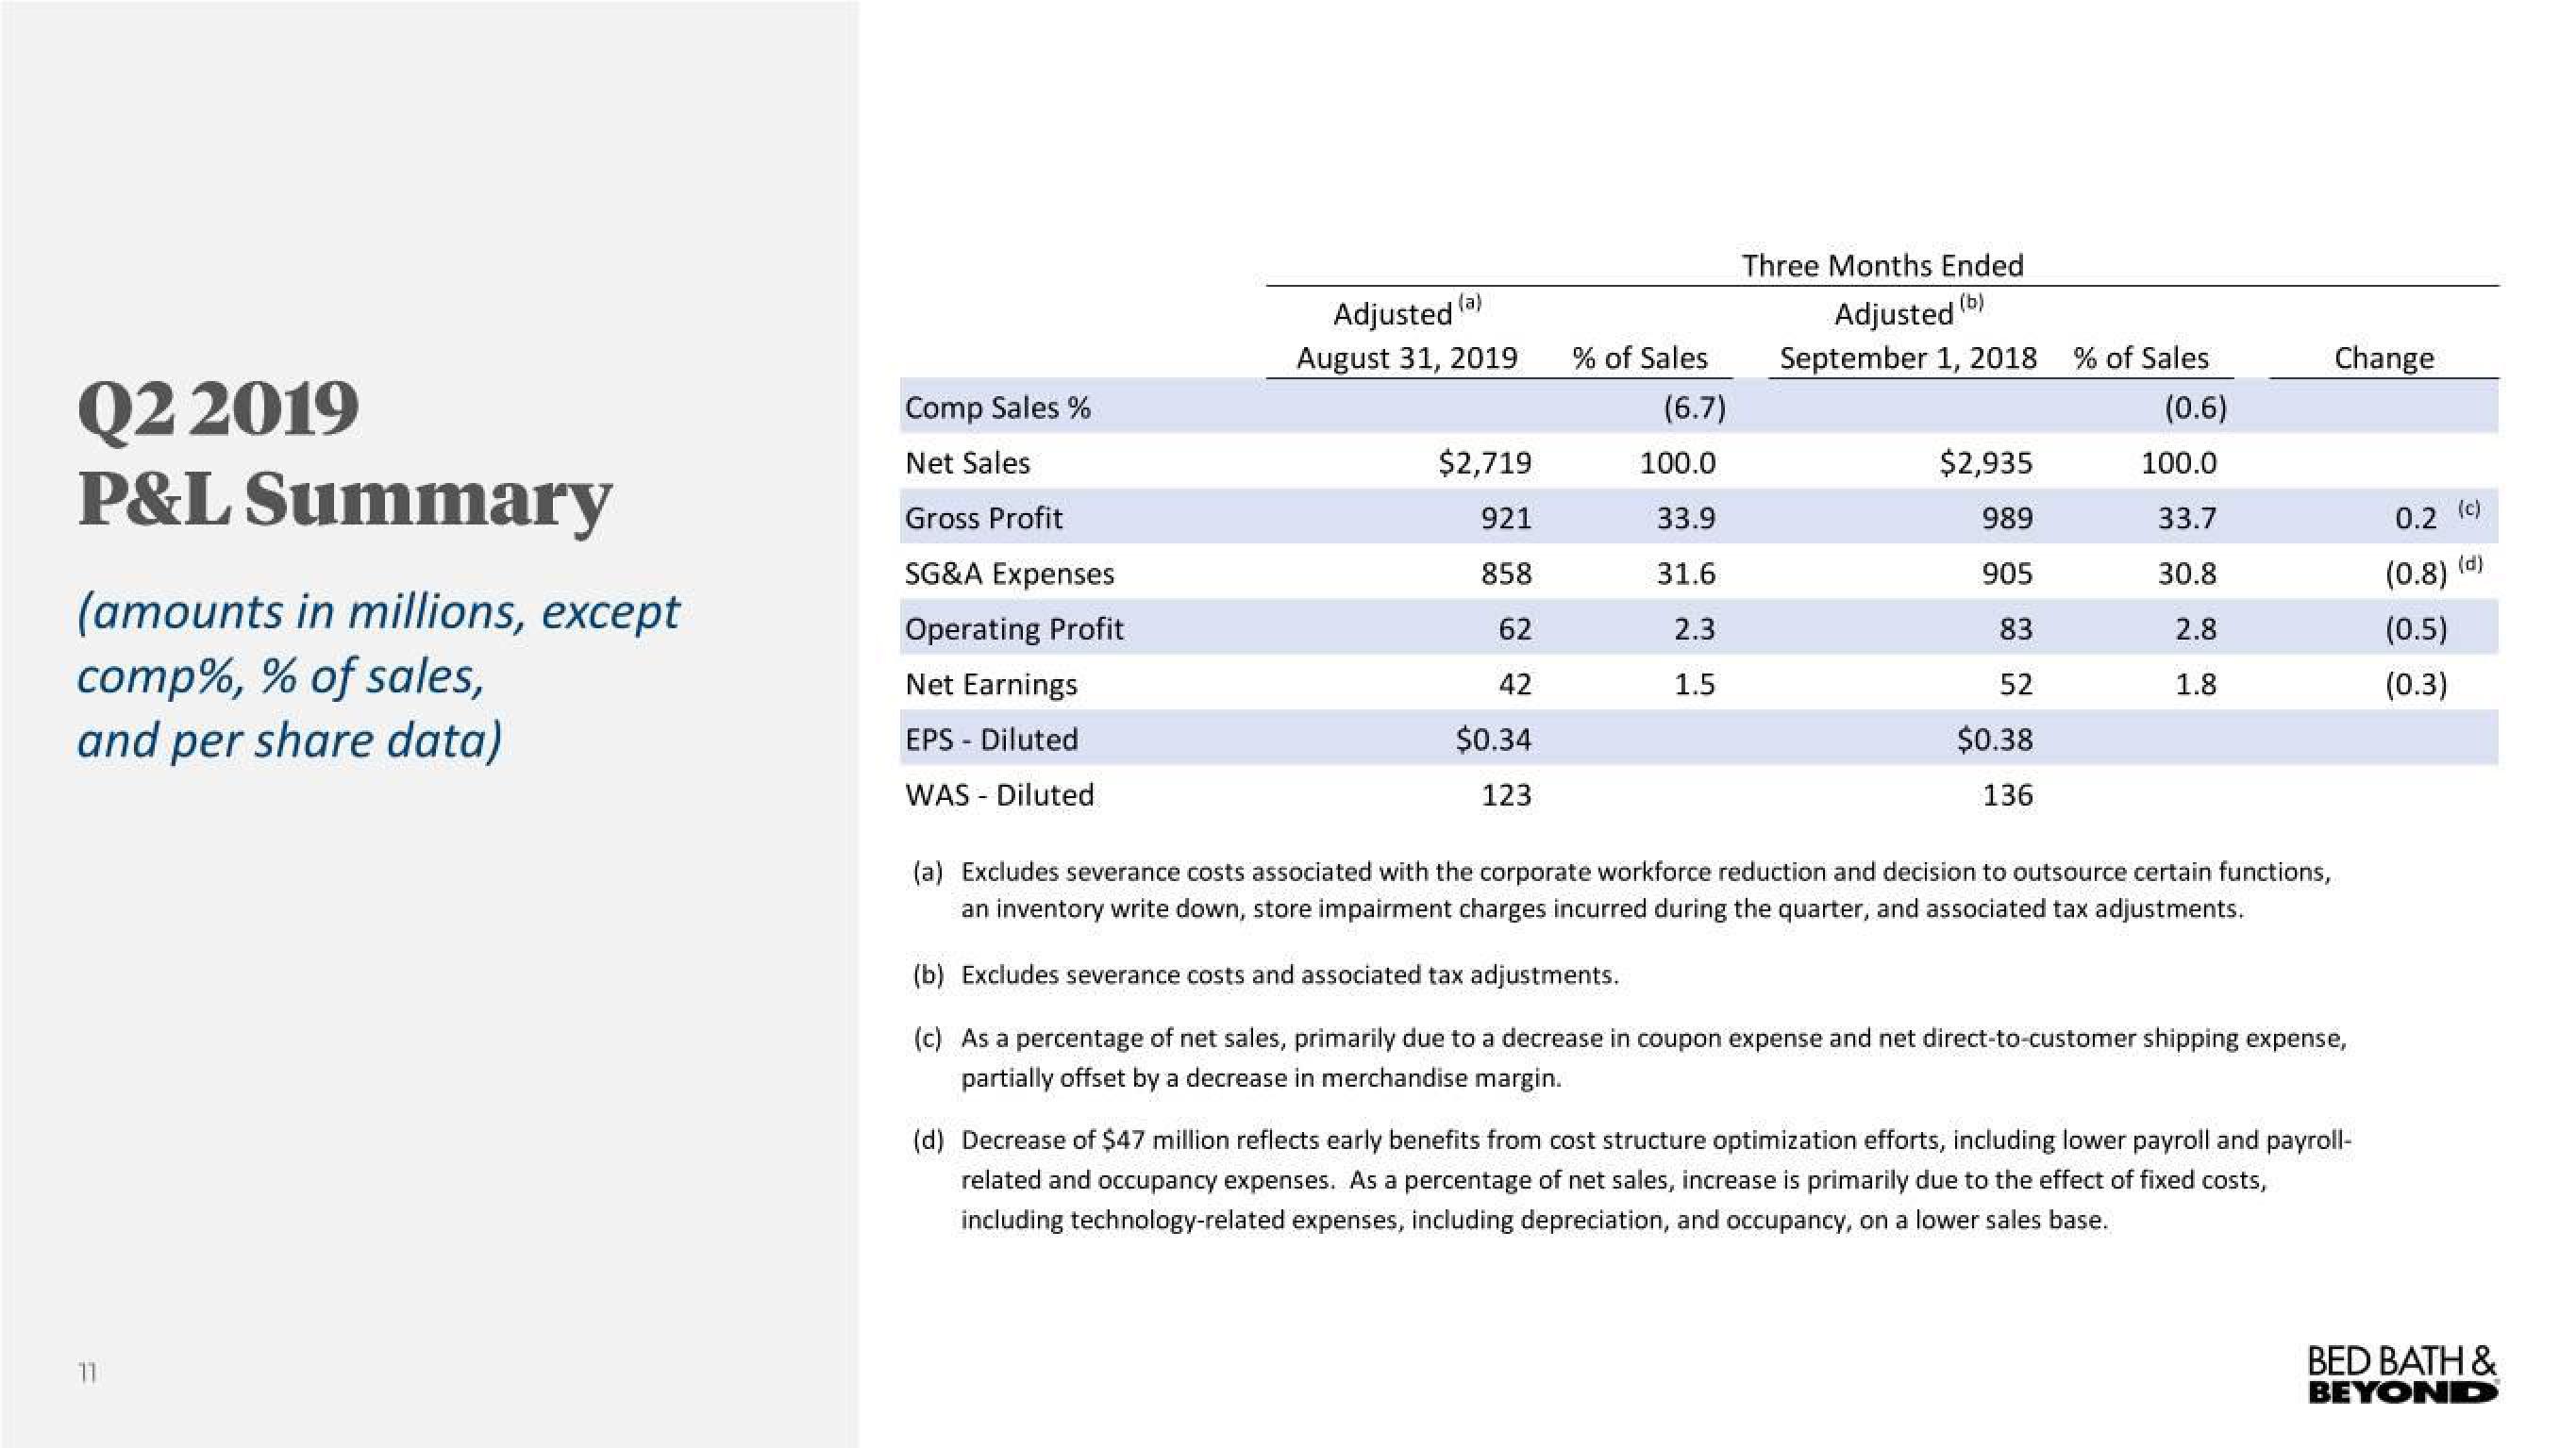
(a) Excludes severance costs associated with the corporate workforce reduction and decision to outsource certain functions,
an inventory write down, store impairment charges incurred during the quarter, and associated tax adjustments.
(b) Excludes severance costs and associated tax adjustments.
(c) As a percentage of net sales, primarily due to a decrease in coupon expense and net direct-to-customer shipping expense,
partially offset by a decrease in merchandise margin.
(d) Decrease of $47 million reflects early benefits from cost structure optimization efforts, including lower payroll and payroll-
related and occupancy expenses. As a percentage of net sales, increase is primarily due to the effect of fixed costs,
including technology-related expenses, including depreciation, and occupancy, on a lower sales base.
0.2 (c)
(0.8) (d)
(0.5)
(0.3)
BED BATH &
BEYONDView entire presentation