Near SPAC Presentation Deck
High Growth Business with Attractive Financial Profile
Attractive Financial
Characteristics
Attractive Revenue Mix with
High Revenue Retention
●
●
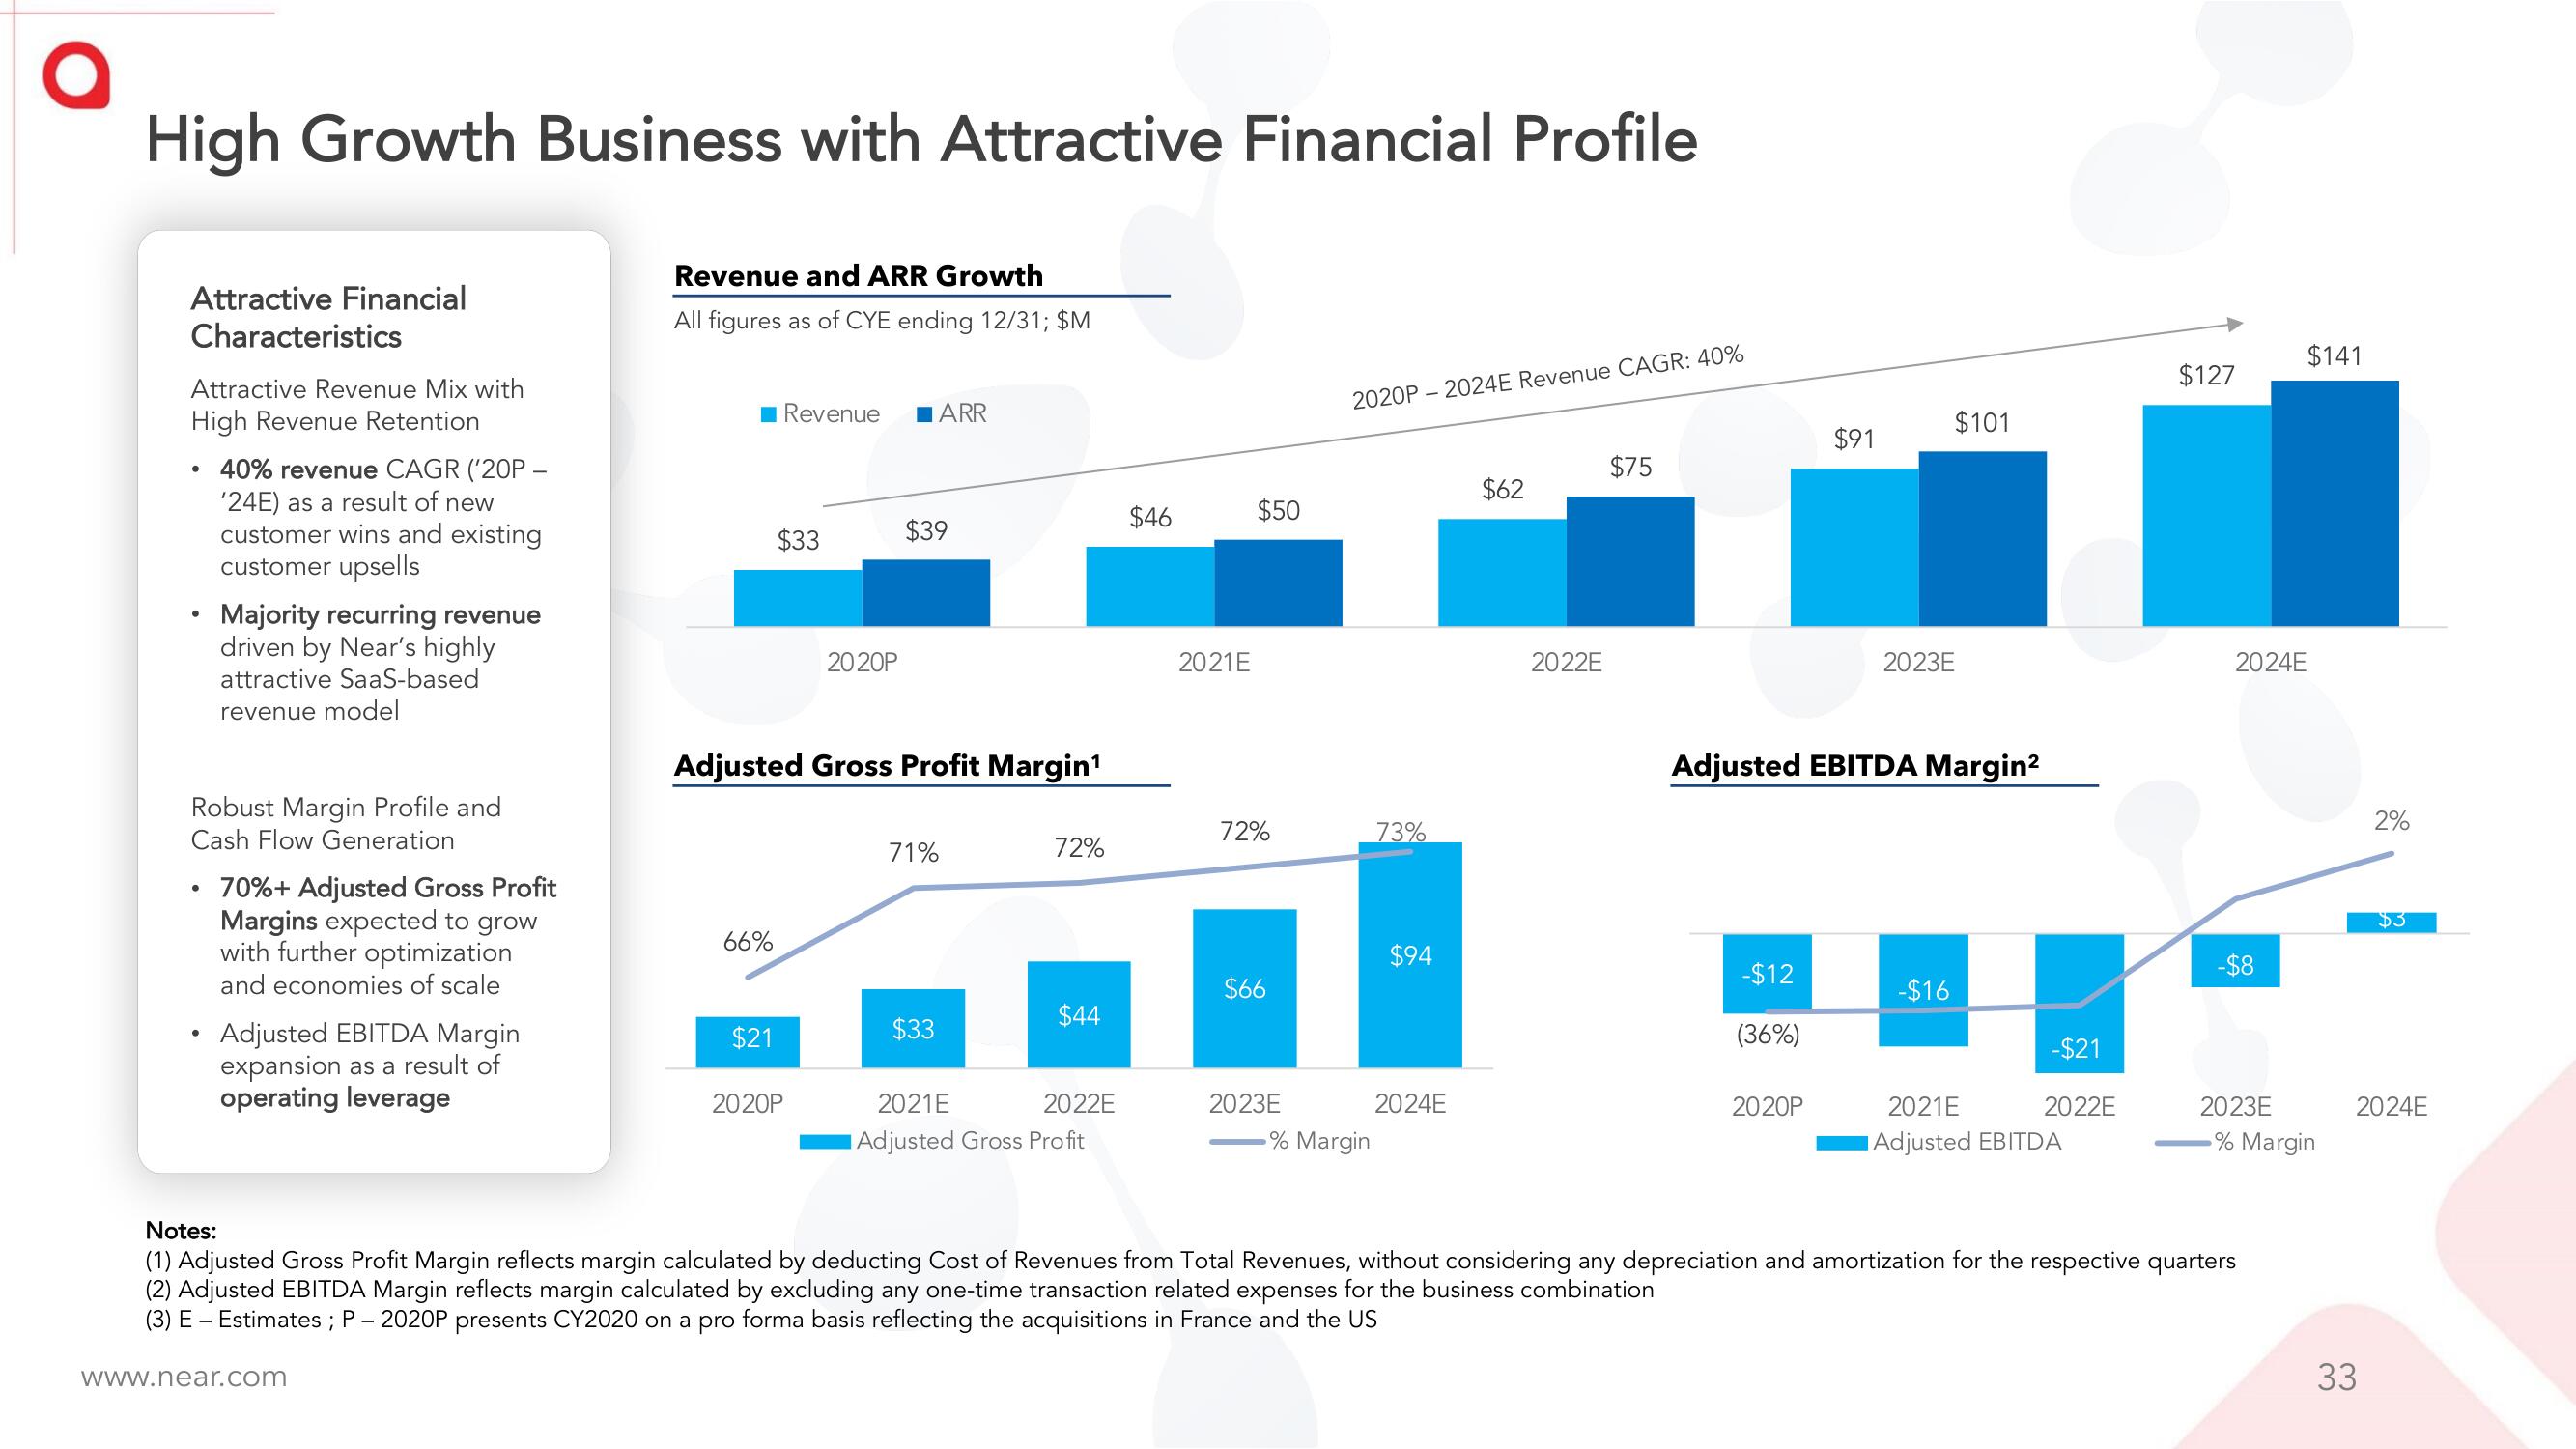
40% revenue CAGR ('20P -
'24E) as a result of new
customer wins and existing
customer upsells
●
Majority recurring revenue
driven by Near's highly
attractive SaaS-based
revenue model
Robust Margin Profile and
Cash Flow Generation
70%+ Adjusted Gross Profit
Margins expected to grow
with further optimization
and economies of scale
Adjusted EBITDA Margin
expansion as a result of
operating leverage
Revenue and ARR Growth
All figures as of CYE ending 12/31; $M
www.near.com
66%
$21
Revenue
$33
2020P
20 20P
Adjusted Gross Profit Margin¹
$39
ARR
71%
$33
72%
$44
2021E
2022E
Adjusted Gross Profit
$46
2021E
$50
72%
$66
2020P2024E Revenue CAGR: 40%
2023E
-% Margin
73%
$94
2024E
$62
2022E
$75
-$12
(36%)
$91
2020P
2023E
Adjusted EBITDA Margin²
$101
-$16
-$21
2022E
2021E
Adjusted EBITDA
$127
2024E
-$8
$141
Notes:
(1) Adjusted Gross Profit Margin reflects margin calculated by deducting Cost of Revenues from Total Revenues, without considering any depreciation and amortization for the respective quarters
(2) Adjusted EBITDA Margin reflects margin calculated by excluding any one-time transaction related expenses for the business combination
(3) E - Estimates ; P - 2020P presents CY2020 on a pro forma basis reflecting the acquisitions in France and the US
2023E
% Margin
2%
33
$3
2024EView entire presentation