Kinnevik Results Presentation Deck
Intro
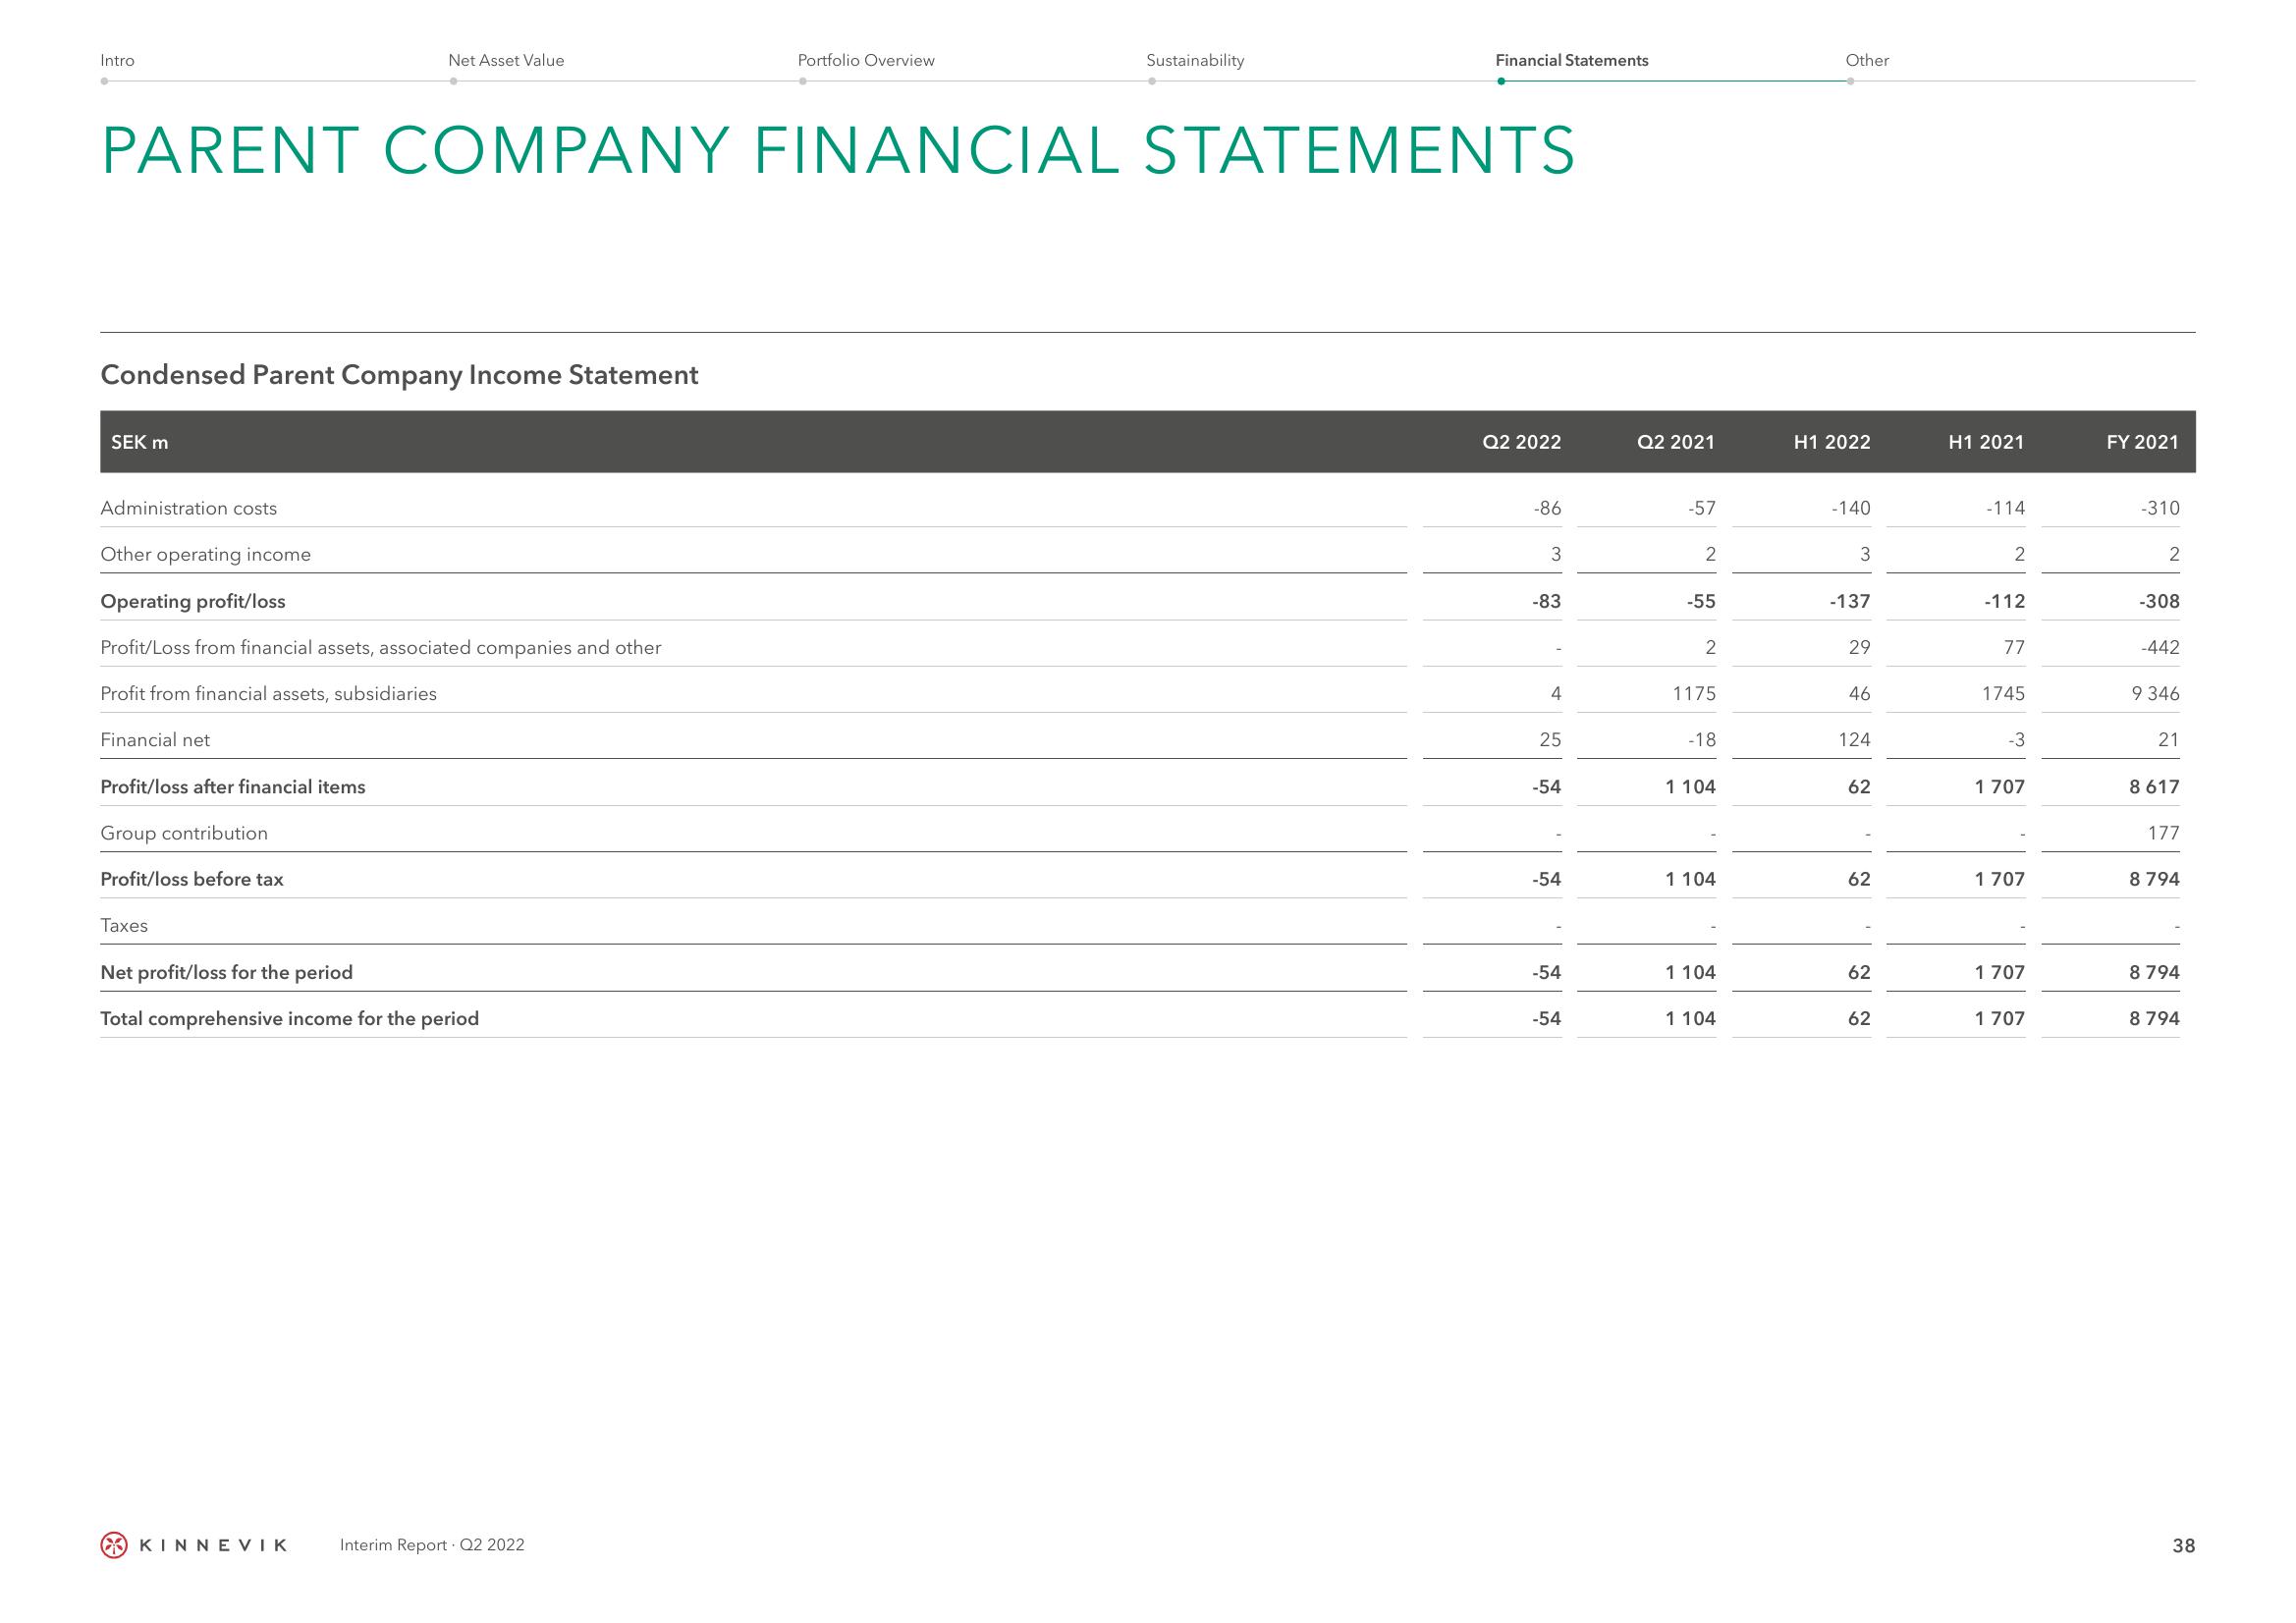
Condensed Parent Company Income Statement
SEK m
Administration costs
PARENT COMPANY FINANCIAL STATEMENTS
Other operating income
Operating profit/loss
Profit/Loss from financial assets, associated companies and other
Profit from financial assets, subsidiaries
Financial net
Profit/loss after financial items
Net Asset Value
Group contribution
Profit/loss before tax
Taxes
Net profit/loss for the period
Total comprehensive income for the period
KINNEVIK
Portfolio Overview
Interim Report. Q2 2022
Sustainability
Financial Statements
Q2 2022
-86
3
-83
4
25
-54
-54
-54
-54
Q2 2021
-57
2
-55
2
1175
-18
1 104
1 104
1104
1 104
Other
H1 2022
-140
3
-137
29
46
124
62
62
62
62
H1 2021
-114
2
-112
77
1745
-3
1 707
1 707
1 707
1 707
FY 2021
-310
2
-308
-442
9 346
21
8 617
177
8 794
8 794
8794
38View entire presentation