Maersk Investor Presentation Deck
Financial highlights
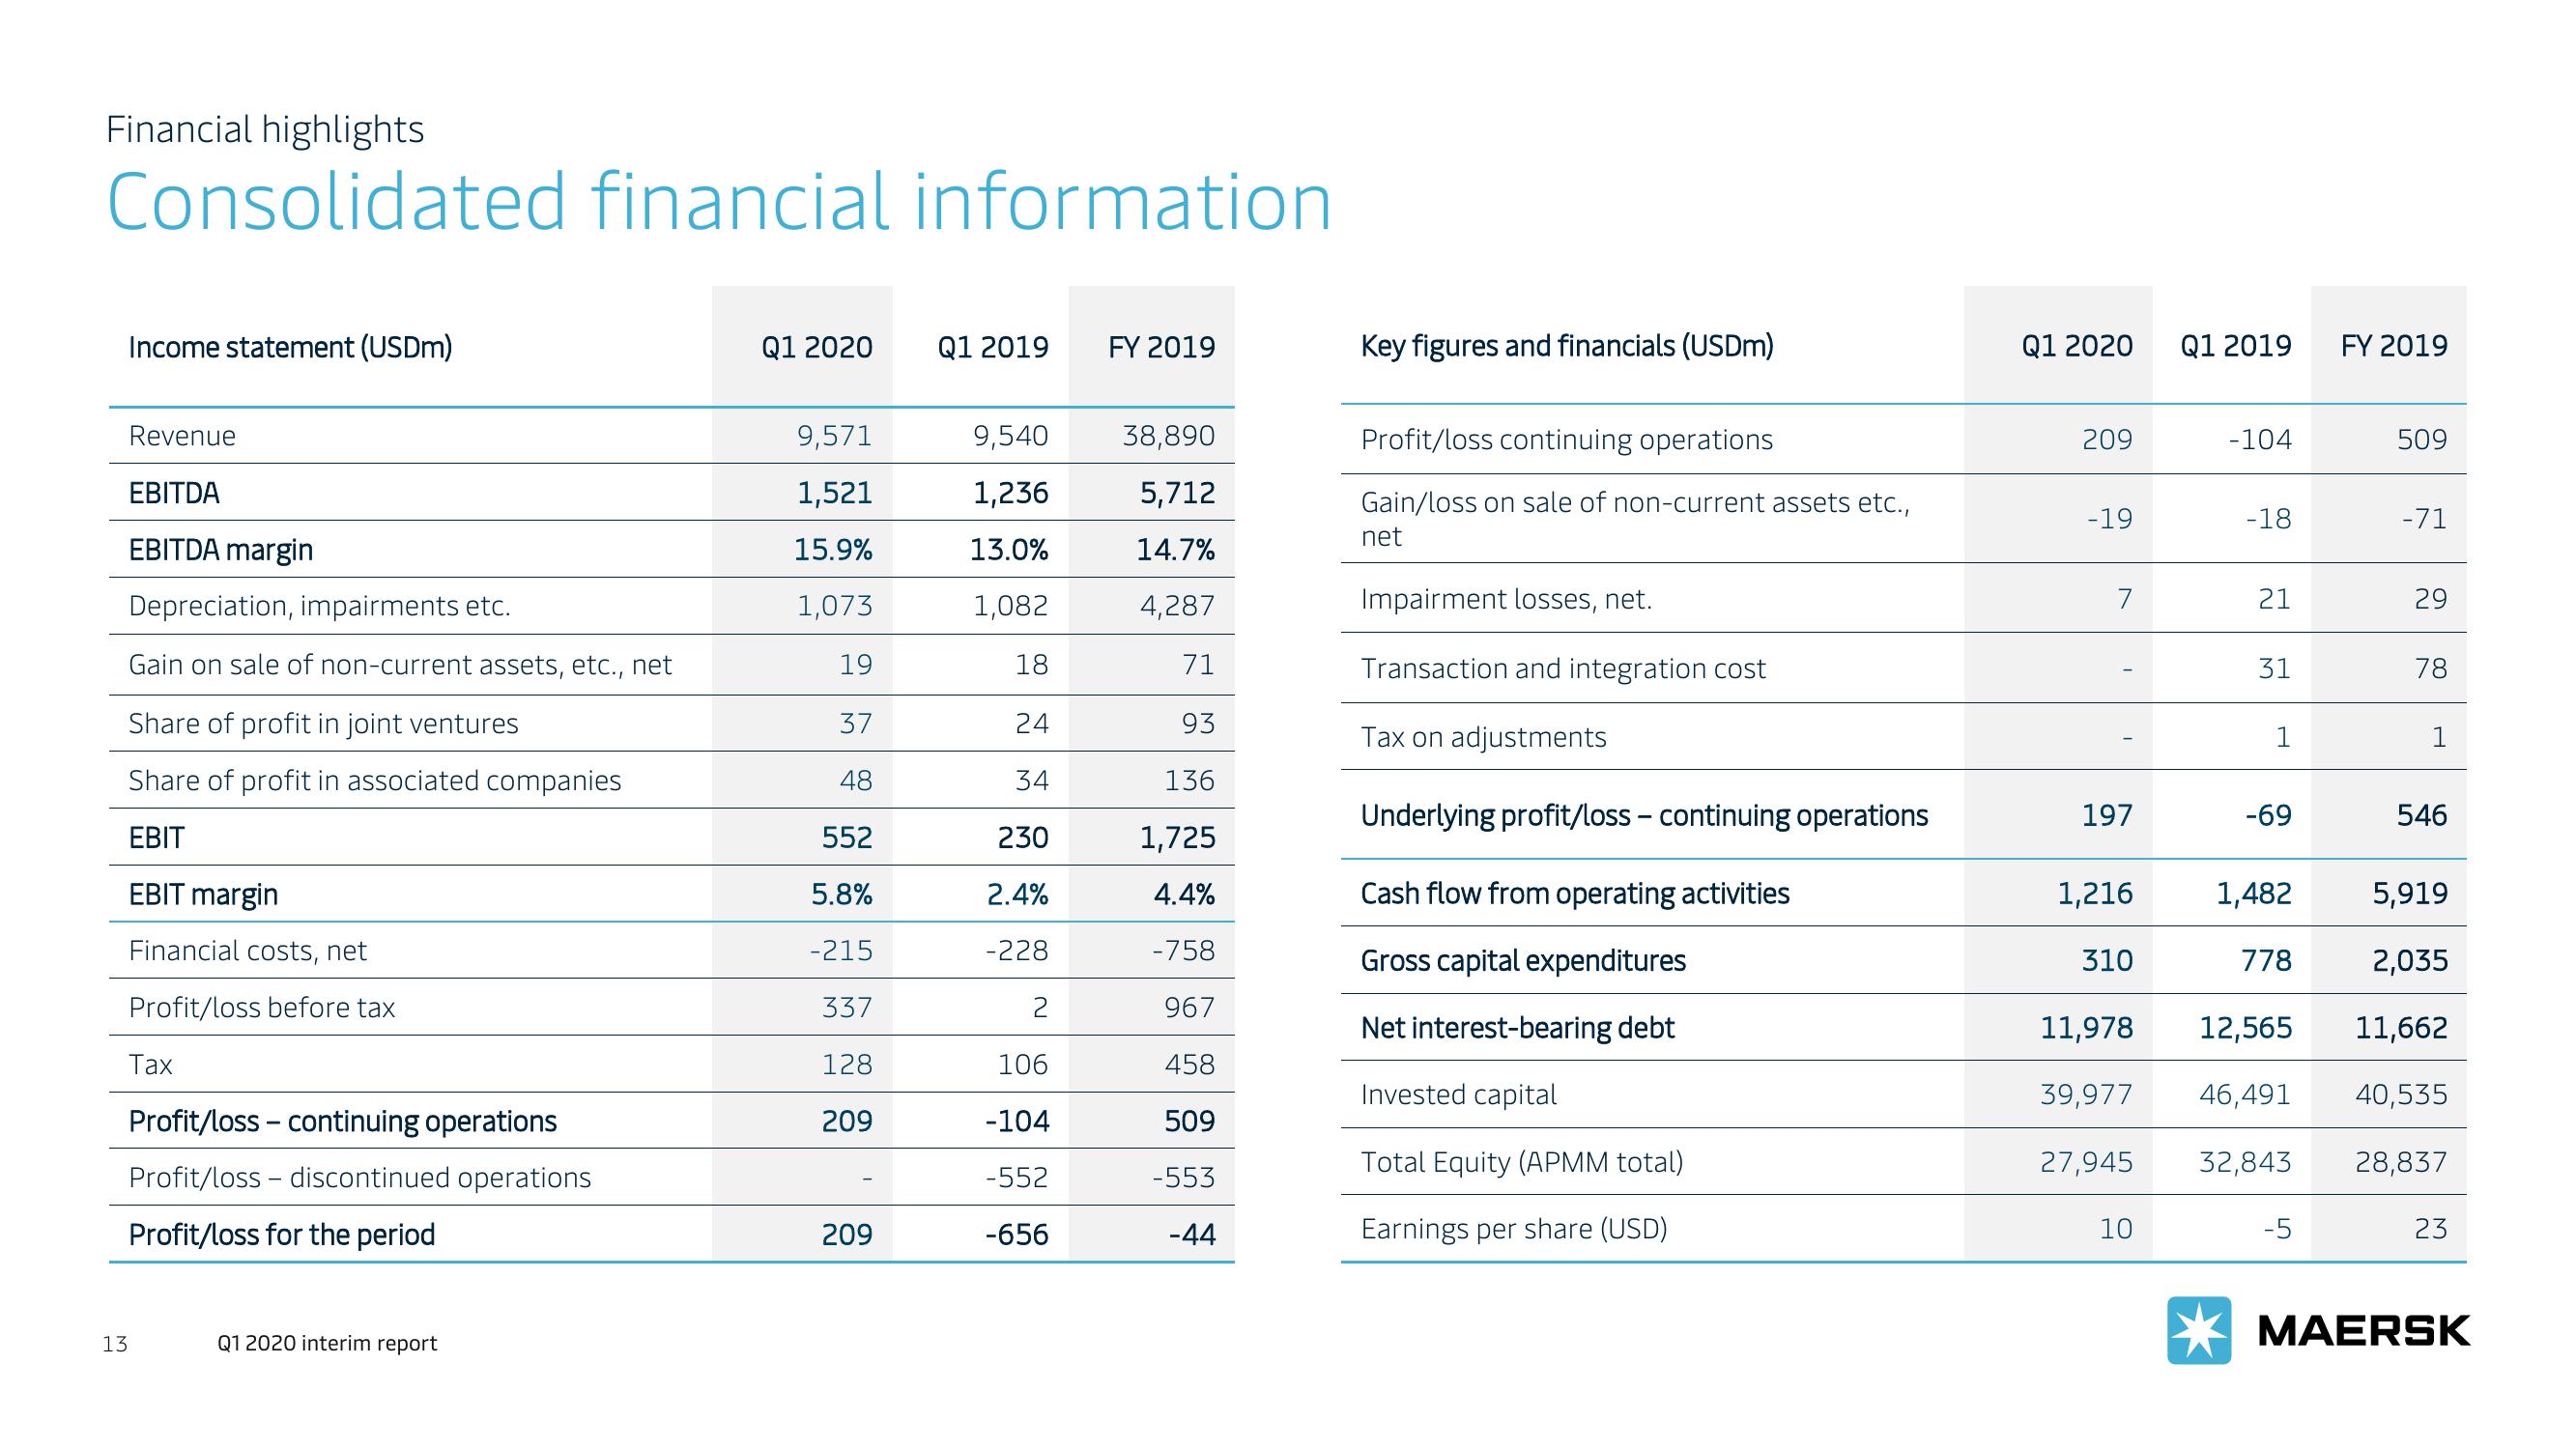
Consolidated financial information
Income statement (USDm)
Revenue
EBITDA
EBITDA margin
Depreciation, impairments etc.
Gain on sale of non-current assets, etc., net
Share of profit in joint ventures
Share of profit in associated companies
EBIT
EBIT margin
Financial costs, net
Profit/loss before tax
Tax
Profit/loss - continuing operations
Profit/loss discontinued operations
Profit/loss for the period
13
Q1 2020 interim report
Q1 2020
9,571
1,521
15.9%
1,073
19
37
48
552
5.8%
-215
337
128
209
209
Q1 2019
9,540
1,236
13.0%
1,082
18
24
34
230
2.4%
-228
2
106
-104
-552
-656
FY 2019
38,890
5,712
14.7%
4,287
71
93
136
1,725
4.4%
-758
967
458
509
-553
-44
Key figures and financials (USDm)
Profit/loss continuing operations
Gain/loss on sale of non-current assets etc.,
net
Impairment losses, net.
Transaction and integration cost
Tax on adjustments
Underlying profit/loss - continuing operations
Cash flow from operating activities
Gross capital expenditures
Net interest-bearing debt
Invested capital
Total Equity (APMM total)
Earnings per share (USD)
Q1 2020
209
-19
7
197
1,216
310
11,978
39,977
27,945
10
Q1 2019
-104
-18
21
31
1
-69
1,482
778
FY 2019
-5
509
-71
29
78
1
546
5,919
2,035
12,565
11,662
46,491 40,535
32,843
28,837
23
MAERSKView entire presentation