Zegna Investor Presentation Deck
4. Key financials overview
FOCUS ON THOM BROWNE SEGMENT
KEY FINANCIALS
including Thom Browne
12 months contribution³
117
NEW YORK
NEW YORK
19
2018A
THOM BROWNE.
11101
2010.
+37% ¹
161
2019A
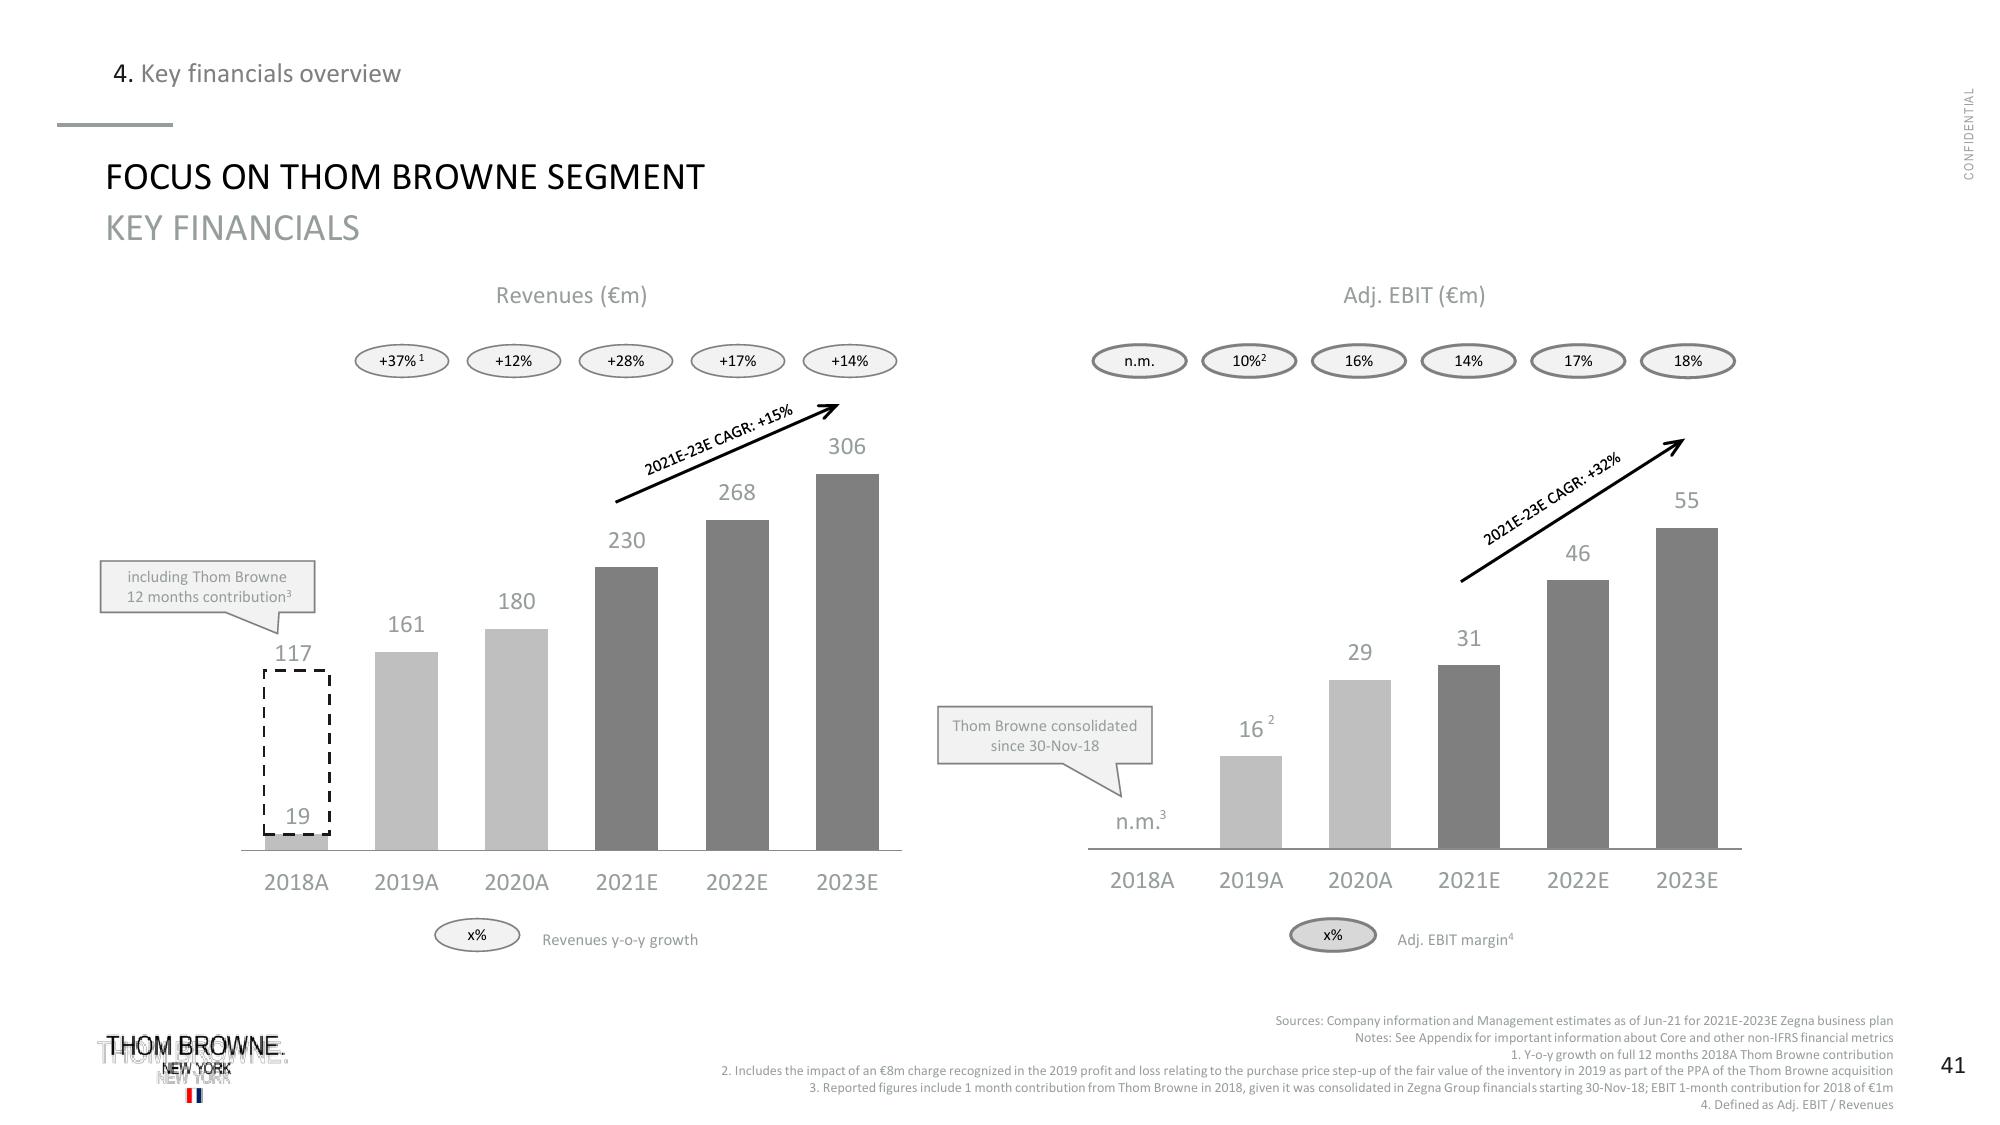
Revenues (€m)
x%
+12%
180
+28%
2021E-23E CAGR: +15%
230
2020A 2021E
+17%
Revenues y-o-y growth
268
2022E
+14%
306
2023E
n.m.
Thom Browne consolidated
since 30-Nov-18.
3
n.m.³
2018A
10%²
16
2
2019A
Adj. EBIT (€m)
16%
x%
29
2020A
14%
2021E-23E CAGR: +32%
31
2021E
17%
Adj. EBIT margin
46
2022E
18%
55
2023E
Sources: Company information and Management estimates as of Jun-21 for 2021E-2023E Zegna business plan
Notes: See Appendix for important information about Core and other non-IFRS financial metrics
1. Y-o-y growth on full 12 months 2018A Thom Browne contribution
2. Includes the impact of an €8m charge recognized in the 2019 profit and loss relating to the purchase price step-up of the fair value of the inventory in 2019 as part of the PPA of the Thom Browne acquisition
3. Reported figures include 1 month contribution from Thom Browne in 2018, given it was consolidated in Zegna Group financials starting 30-Nov-18; EBIT 1-month contribution for 2018 of €1m
4. Defined as Adj. EBIT/ Revenues
CONFIDENTIAL
41View entire presentation