Credit Suisse Investment Banking Pitch Book
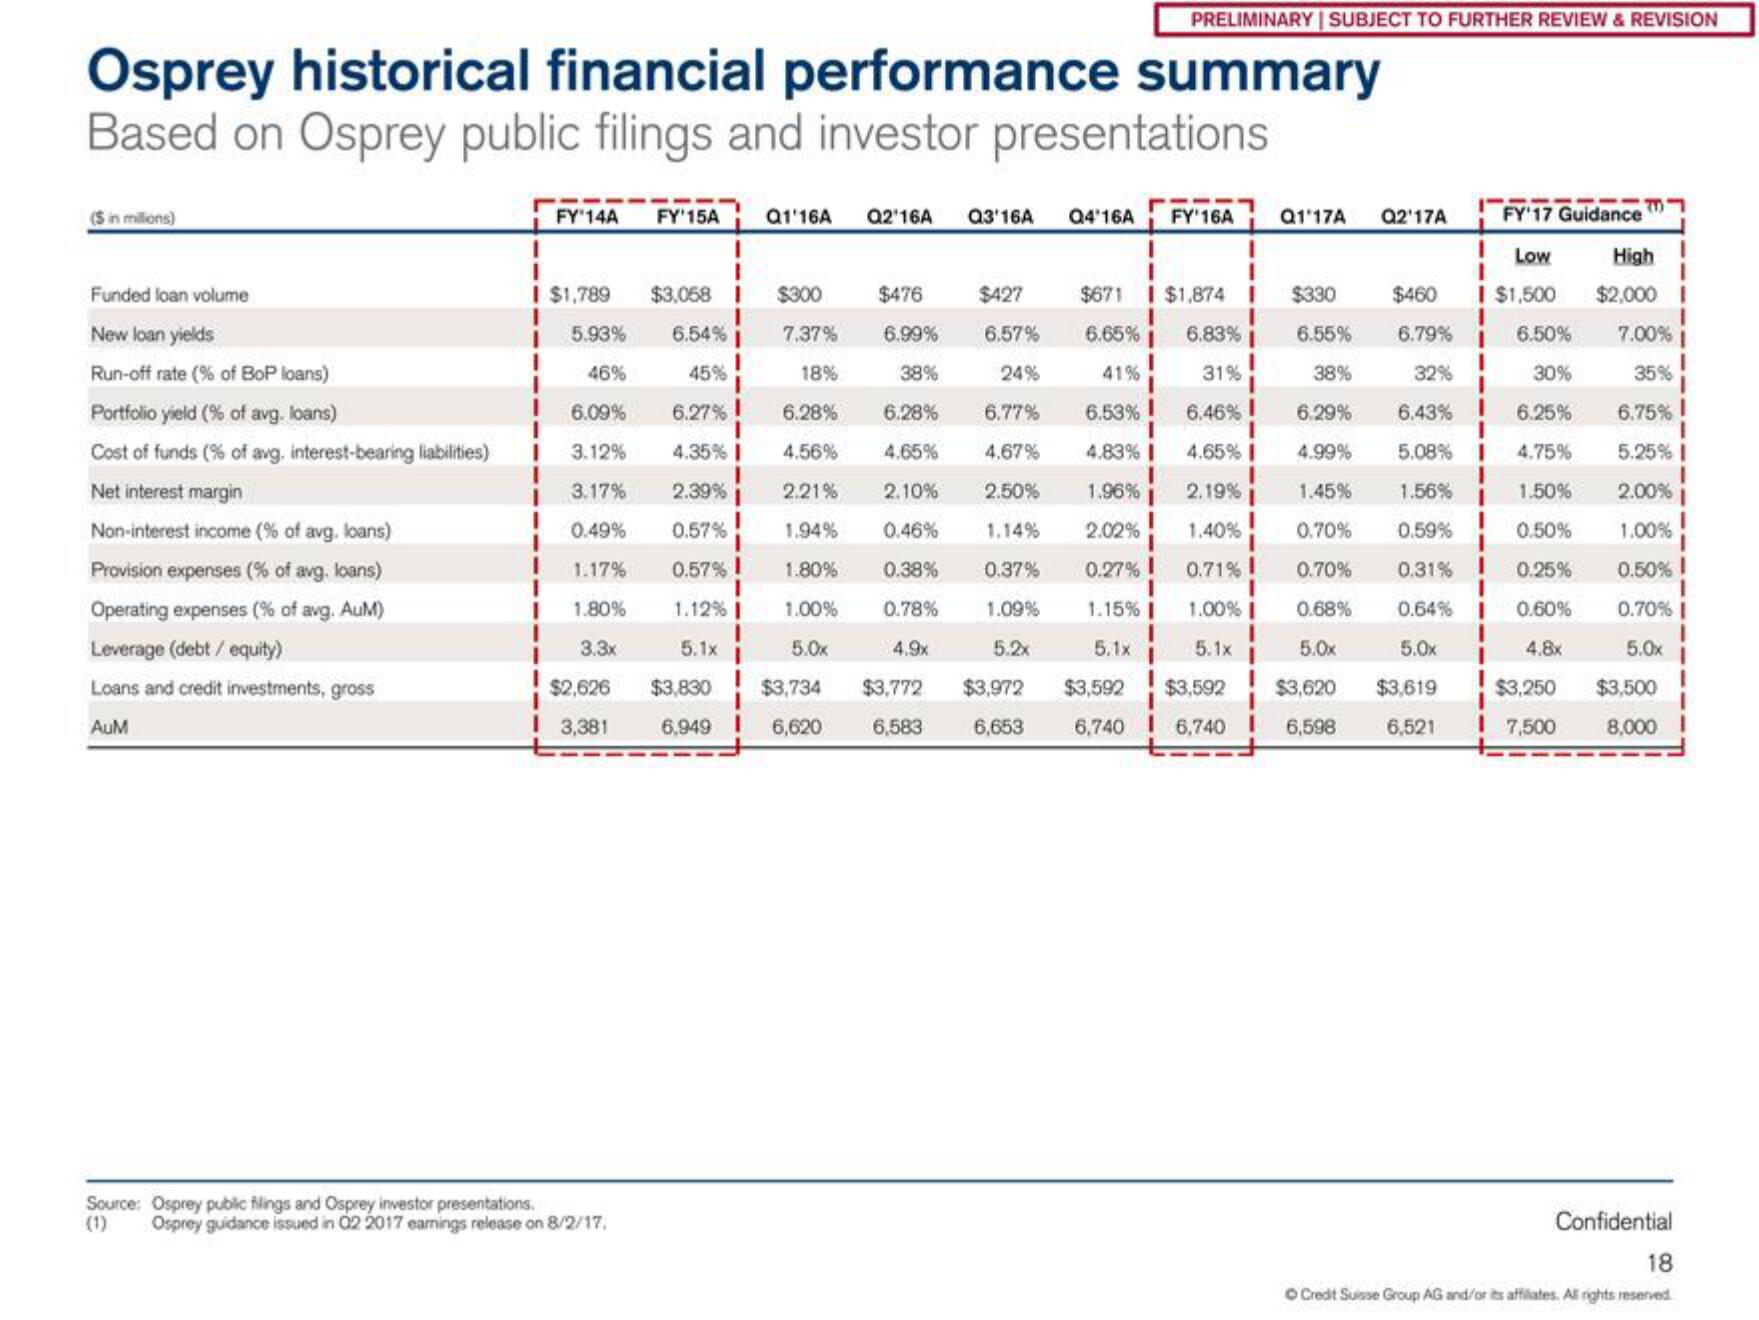
Osprey historical financial performance summary
Based on Osprey public filings and investor presentations
(Sin millions)
Funded loan volume
New loan yields
Run-off rate (% of BoP loans)
Portfolio yield (% of avg. loans)
Cost of funds (% of avg. interest-bearing liabilities)
Net interest margin
Non-interest income (% of avg. loans)
Provision expenses (% of avg. loans)
Operating expenses (% of avg. AuM)
Leverage (debt / equity)
Loans and credit investments, gross
AUM
FY'14A FY'15A Q1'16A Q2'16A Q3'16A Q4'16A FY'16A Q1'17A
I
I
I $1,789
5.93%
46%
6.09%
3.12%
3.17%
0.49%
1.17%
1.80%
3.3x
$2,626
I 3,381
Source: Osprey public filings and Osprey investor presentations.
Osprey guidance issued in 02 2017 earnings release on 8/2/17.
$3,058 I
6.54%
45%
6.27%
4.35% I
2.39%
0.57%
0.57% I
1.12% I
5.1x
$300
7.37%
18%
6.28%
4.56%
2.21%
1.94%
1.80%
1.00%
5.0x
$3,830
$3,734
6,949 I 6,620
$476
6.99%
38%
6.28%
4.65%
2.10%
0.46%
0.38%
0.78%
4.9x
$3,772
6,583
PRELIMINARY | SUBJECT TO FURTHER REVIEW & REVISION
$427
6.57%
24%
6.77%
4.67%
2.50%
1.14%
0.37%
1.09%
5.2x
$3,972
6,653
Q2'17A
FY'17 Guidance
Low
I
$460 I $1,500
6.79% I 6.50%
1
32%
30%
$671 $1,874 I $330
6.65% 6.83% 6.55%
41%
31%
38%
6.53% 6.46% 6.29%
6.43% I
I
4.83% I 4.65% I 4.99% 5.08% I
1.96%
2.19%
1.45% 1.56%
1
I
2.02% 1.40%
0.70% 0.59%
0.27% I
0.71% I
0.70%
0.31% I
1.15% I 1.00% I 0.68% 0.64% I
5.1x
5.1x
5.0x
5.0x
$3,592 $3,592 $3,620 $3,619
6,740 I 6,740 6,598 6,521
6.25%
4.75%
1.50%
0.50%
0.25%
0.60%
4.8x
$3,250
I 7,500
High!
$2,000
7.00%
35%
6.75%
5.25% I
2.00%
1.00%
0.50%
0.70% I
5.0x
$3,500
8,000
Confidential
18
Credit Suisse Group AG and/or its affiliates. All rights reserved.View entire presentation