Cooper Standard Third Quarter 2023 Earnings Presentation
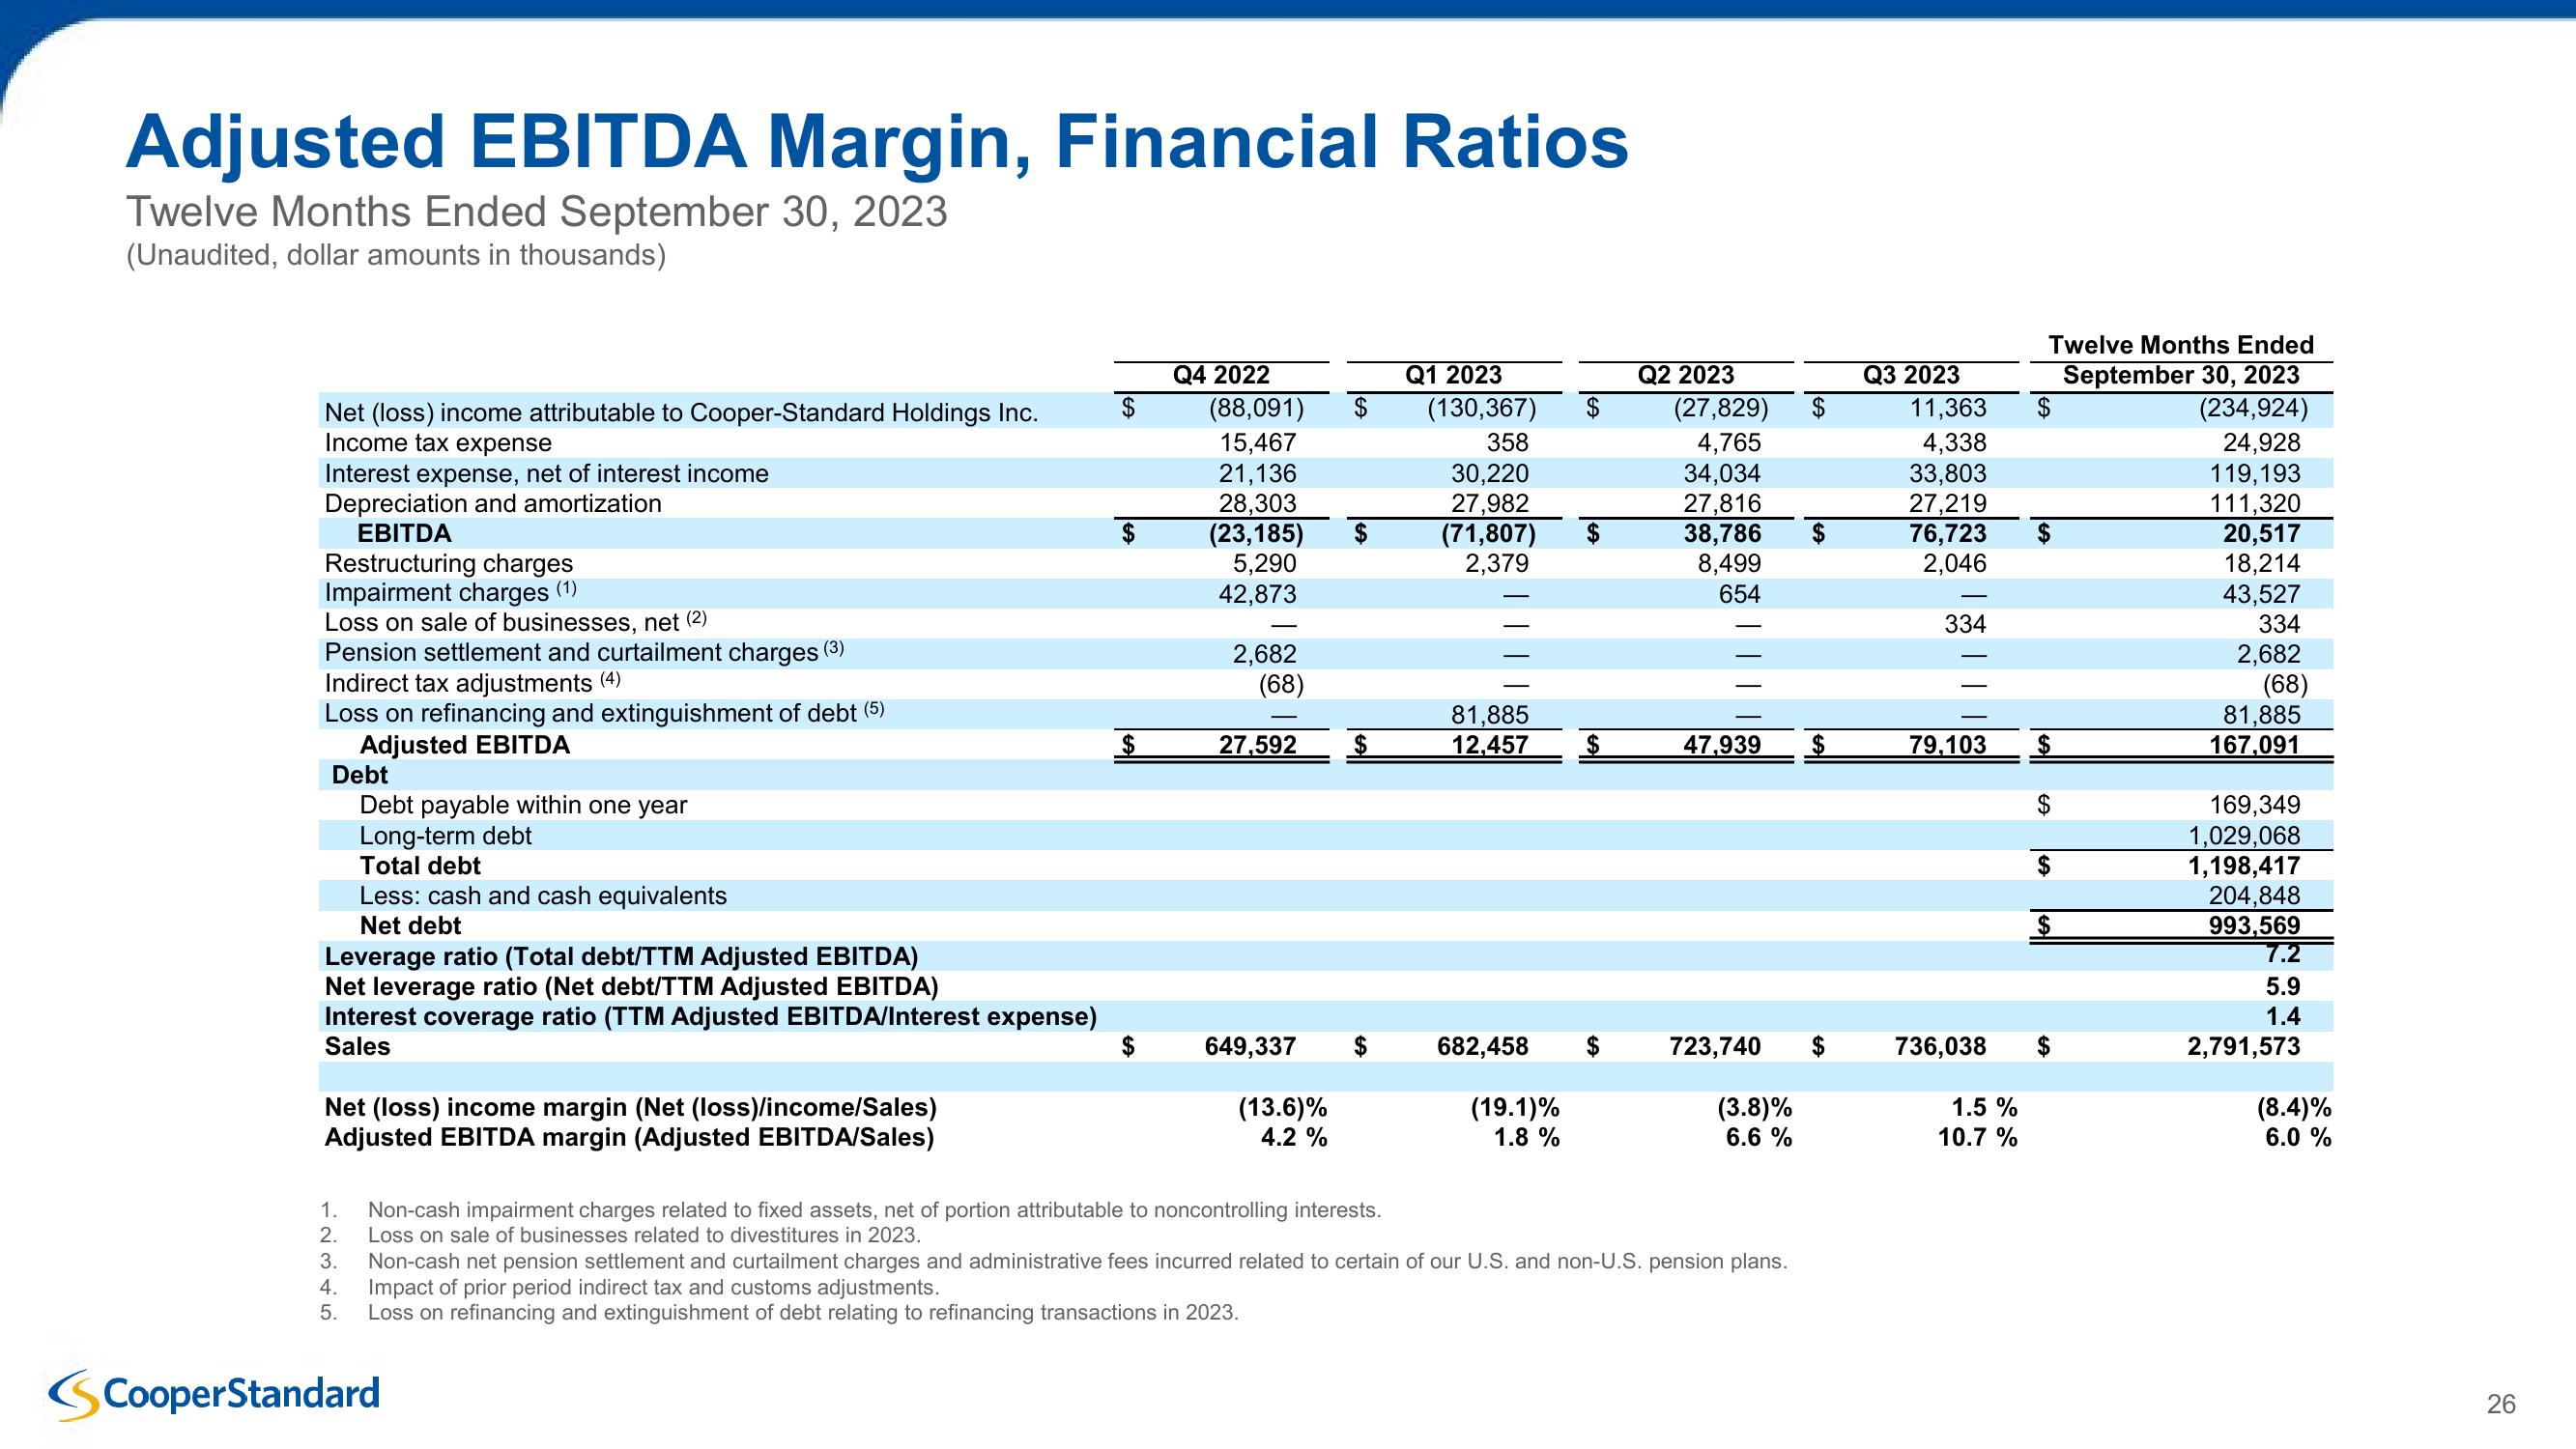
Adjusted EBITDA Margin, Financial Ratios
Twelve Months Ended September 30, 2023
(Unaudited, dollar amounts in thousands)
Net (loss) income attributable to Cooper-Standard Holdings Inc.
Income tax expense
Interest expense, net of interest income
Depreciation and amortization
EBITDA
Restructuring charges
Impairment charges (1)
Loss on sale of businesses, net (2)
Pension settlement and curtailment charges (3)
Indirect tax adjustments (4)
Loss on refinancing and extinguishment of debt (5)
Adjusted EBITDA
Debt
Debt payable within one year
Long-term debt
Total debt
Less: cash and cash equivalents
Q4 2022
(88,091)
Q1 2023
(130,367)
358
Q2 2023
(27,829)
4,765
SA
Q3 2023
15,467
21,136
30,220
34,034
28,303
27,982
27,816
(23,185)
(71,807)
38,786
5,290
2,379
8,499
42,873
654
2,682
11,363
$
SA
Twelve Months Ended
September 30, 2023
(234,924)
4,338
24,928
33,803
27,219
119,193
111,320
76,723 S
20,517
2,046
18,214
43,527
334
334
2,682
(68)
(68)
27.592
$
81,885
12,457
81,885
47,939
$
79,103
167,091
$
169,349
1,029,068
1,198,417
204,848
Net debt
$
993,569
Leverage ratio (Total debt/TTM Adjusted EBITDA)
7.2
Net leverage ratio (Net debt/TTM Adjusted EBITDA)
5.9
Interest coverage ratio (TTM Adjusted EBITDA/Interest expense)
Sales
1.4
649,337
682,458
723,740
736,038
2,791,573
Net (loss) income margin (Net (loss)/income/Sales)
Adjusted EBITDA margin (Adjusted EBITDA/Sales)
(13.6)%
4.2 %
(19.1)%
1.8 %
(3.8)%
6.6 %
1.5 %
10.7 %
(8.4)%
6.0 %
12345
1.
2.
Non-cash impairment charges related to fixed assets, net of portion attributable to noncontrolling interests.
Loss on sale of businesses related to divestitures in 2023.
3.
Non-cash net pension settlement and curtailment charges and administrative fees incurred related to certain of our U.S. and non-U.S. pension plans.
Impact of prior period indirect tax and customs adjustments.
5. Loss on refinancing and extinguishment of debt relating to refinancing transactions in 2023.
CooperStandard
26
26View entire presentation