Comcast Results Presentation Deck
NBCUniversal 2nd Quarter 2022 Overview
Revenue
y/y%
Adj. EBITDA
y/y%
Revenue
$7,955
6
2Q21
$1,553
+18.7%
2Q21
$9,445
Adjusted EBITDA ($M)
2Q22
+19.5%
$1,856
($M)
2Q22
All percentages represent year/year growth rates.
See Notes on Slide 11
($M)
Media
Studios
Theme Parks
$5,332
+3.6%
$2,966
+33.3%
$1,804
+64.8%
$1,337
(2.9%)
$1
(99.5%)
$632
+186.5
Commentary
●
●
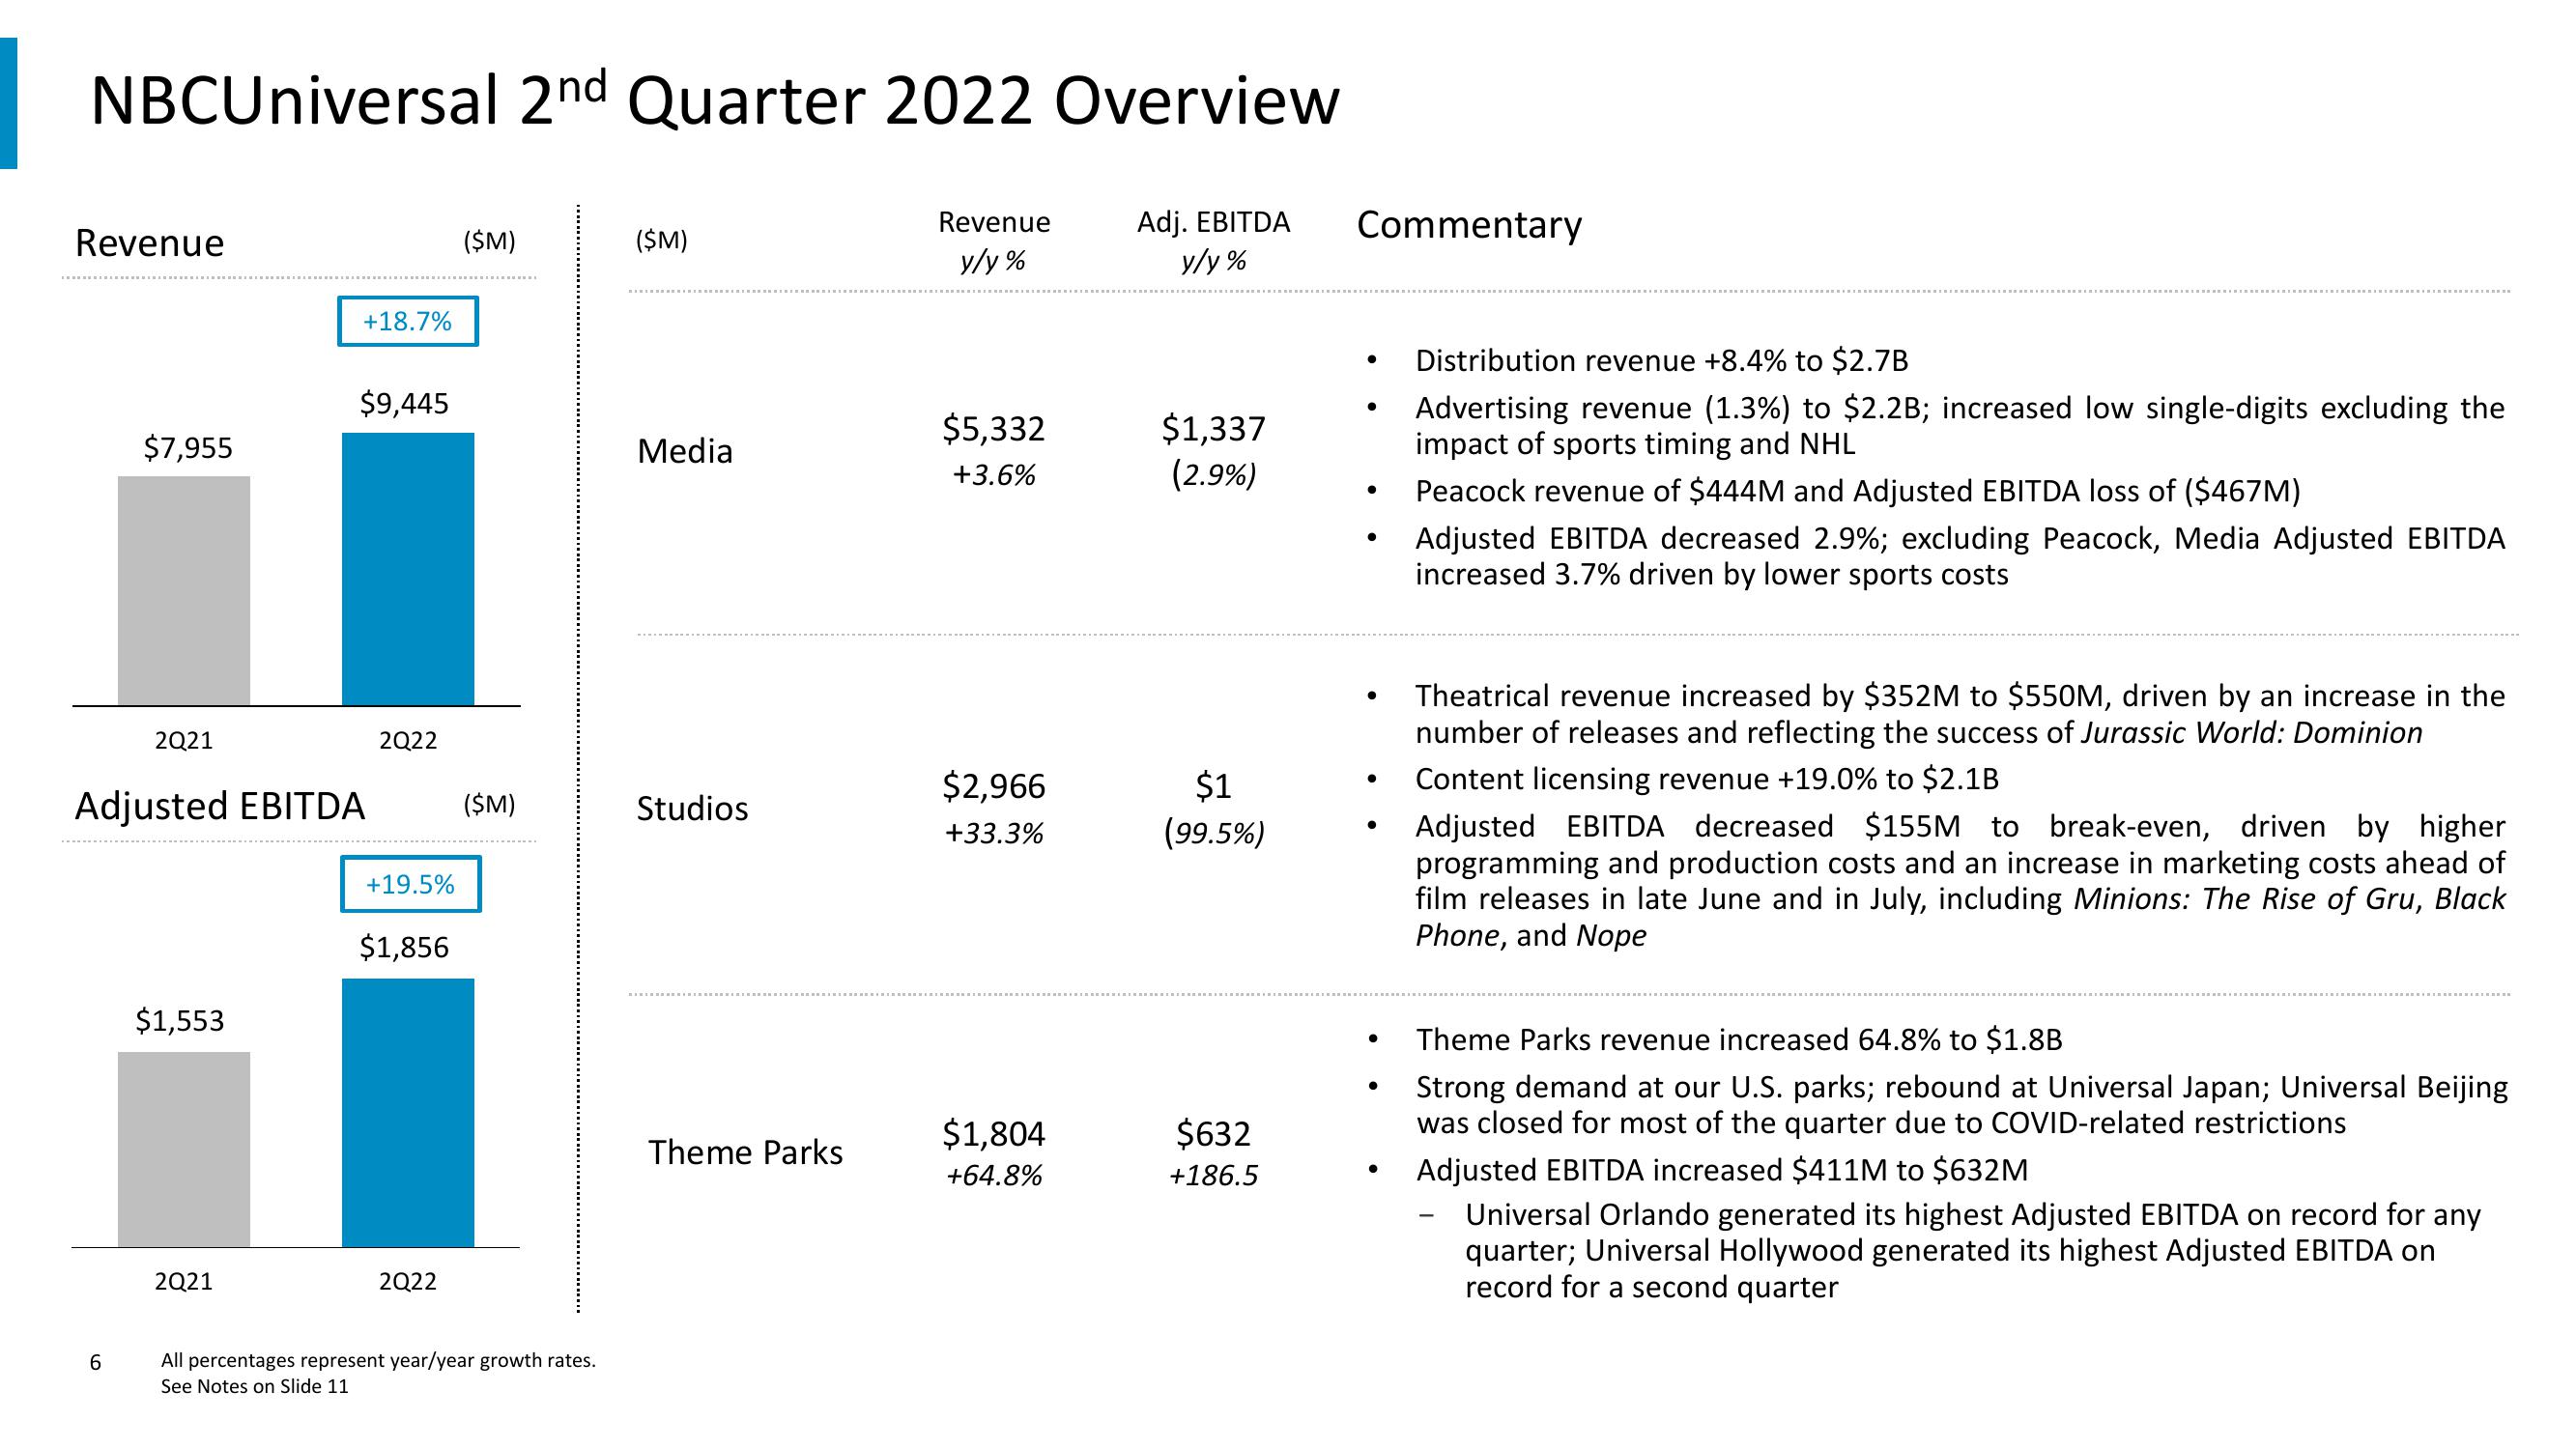
Distribution revenue +8.4% to $2.7B
Advertising revenue (1.3%) to $2.2B; increased low single-digits excluding the
пра of sports timing and NHL
Peacock revenue of $444M and Adjusted EBITDA loss of ($467M)
Adjusted EBITDA decreased 2.9%; excluding Peacock, Media Adjusted EBITDA
increased 3.7% driven by lower sports costs
Theatrical revenue increased by $352M to $550M, driven by an increase in the
number of releases and reflecting the success of Jurassic World: Dominion
Content licensing revenue +19.0% to $2.1B
Adjusted EBITDA decreased $155M to break-even, driven by higher
programming and production costs and an increase in marketing costs ahead of
film releases in late June and in July, including Minions: The Rise of Gru, Black
Phone, and Nope
Theme Parks revenue increased 64.8% to $1.8B
Strong demand at our U.S. parks; rebound at Universal Japan; Universal Beijing
was closed for most of the quarter due to COVID-related restrictions
Adjusted EBITDA increased $411M to $632M
Universal Orlando generated its highest Adjusted EBITDA on record for any
quarter; Universal Hollywood generated its highest Adjusted EBITDA on
record for a second quarterView entire presentation