Silicon Valley Bank Results Presentation Deck
Non-GAAP reconciliation
Capital ratios
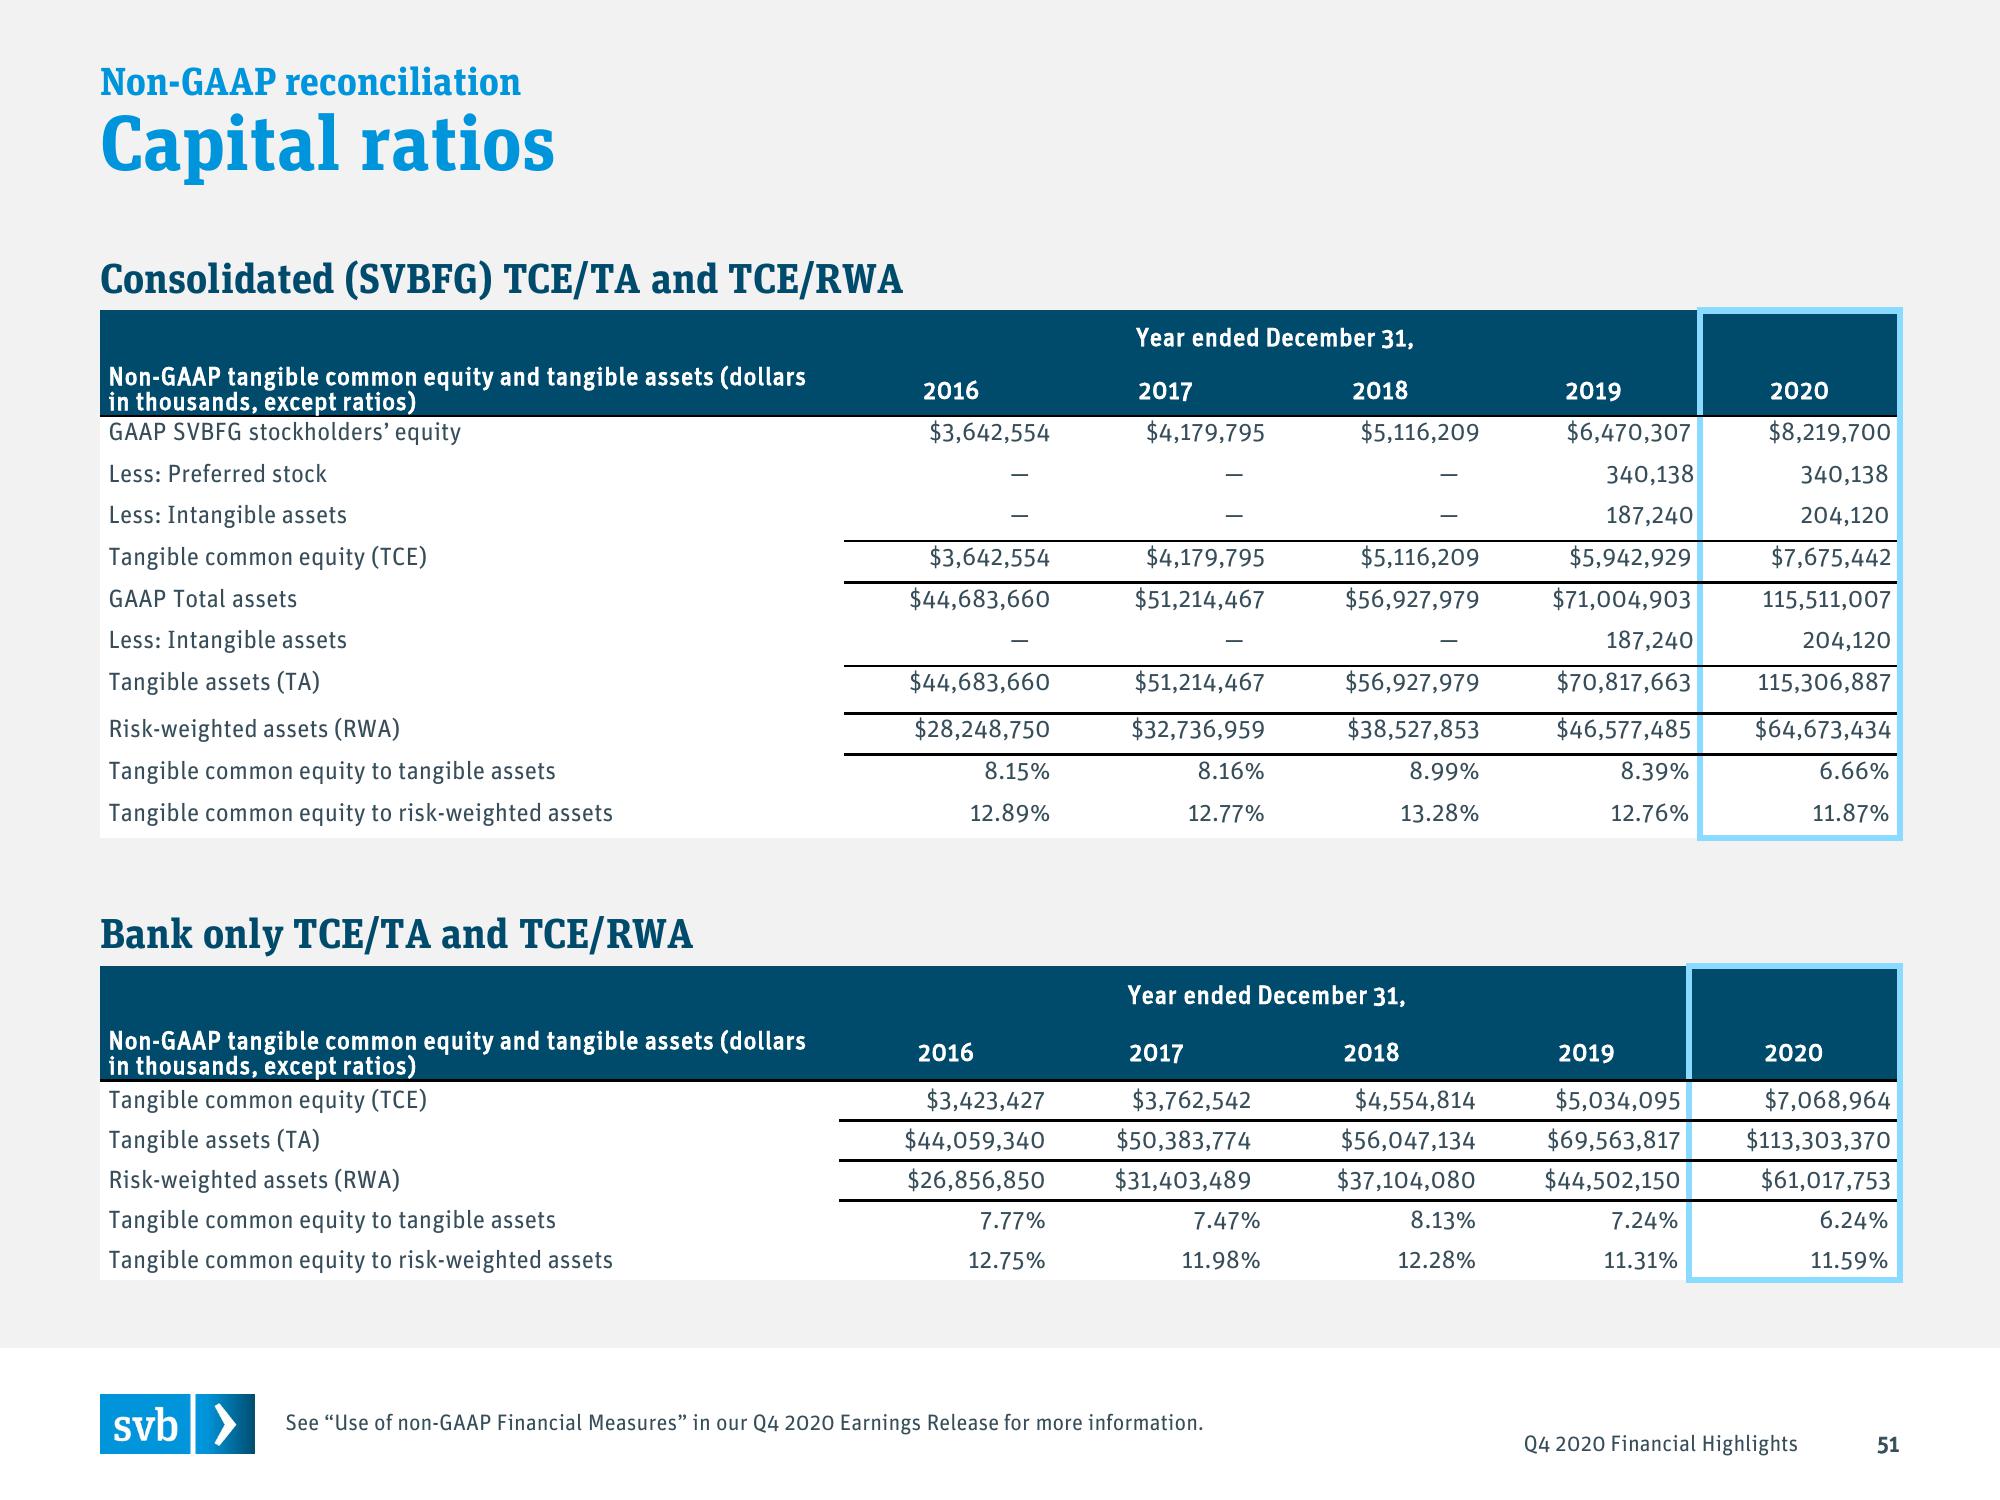
Consolidated (SVBFG) TCE/TA and TCE/RWA
Non-GAAP tangible common equity and tangible assets (dollars
in thousands, except ratios)
GAAP SVBFG stockholders' equity
Less: Preferred stock
Less: Intangible assets
Tangible common equity (TCE)
GAAP Total assets
Less: Intangible assets
Tangible assets (TA)
Risk-weighted assets (RWA)
Tangible common equity to tangible assets
Tangible common equity to risk-weighted assets
Bank only TCE/TA and TCE/RWA
Non-GAAP tangible common equity and tangible assets (dollars
in thousands, except ratios)
Tangible common equity (TCE)
Tangible assets (TA)
Risk-weighted assets (RWA)
Tangible common equity to tangible assets
Tangible common equity to risk-weighted assets
2016
$3,642,554
$3,642,554
$44,683,660
$44,683,660
$28,248,750
8.15%
12.89%
2016
$3,423,427
$44,059,340
$26,856,850
7.77%
12.75%
Year ended December 31,
2017
$4,179,795
$4,179,795
$51,214,467
$51,214,467
$32,736,959
8.16%
12.77%
2017
$3,762,542
$50,383,774
$31,403,489
7.47%
11.98%
2018
svb > See "Use of non-GAAP Financial Measures" in our Q4 2020 Earnings Release for more information.
$5,116,209
$5,116,209
$56,927,979
Year ended December 31,
$56,927,979
$38,527,853
8.99%
13.28%
2018
$4,554,814
$56,047,134
$37,104,080
8.13%
12.28%
2019
$6,470,307
340,138
187,240
$5,942,929
$71,004,903
187,240
$70,817,663
$46,577,485
8.39%
12.76%
2019
$5,034,095
$69,563,817
$44,502,150
7.24%
11.31%
2020
$8,219,700
340,138
204,120
$7,675,442
115,511,007
204,120
115,306,887
$64,673,434
6.66%
11.87%
2020
$7,068,964
$113,303,370
$61,017,753
Q4 2020 Financial Highlights
6.24%
11.59%
51View entire presentation