Factset Investor Day Presentation Deck
FACTSET
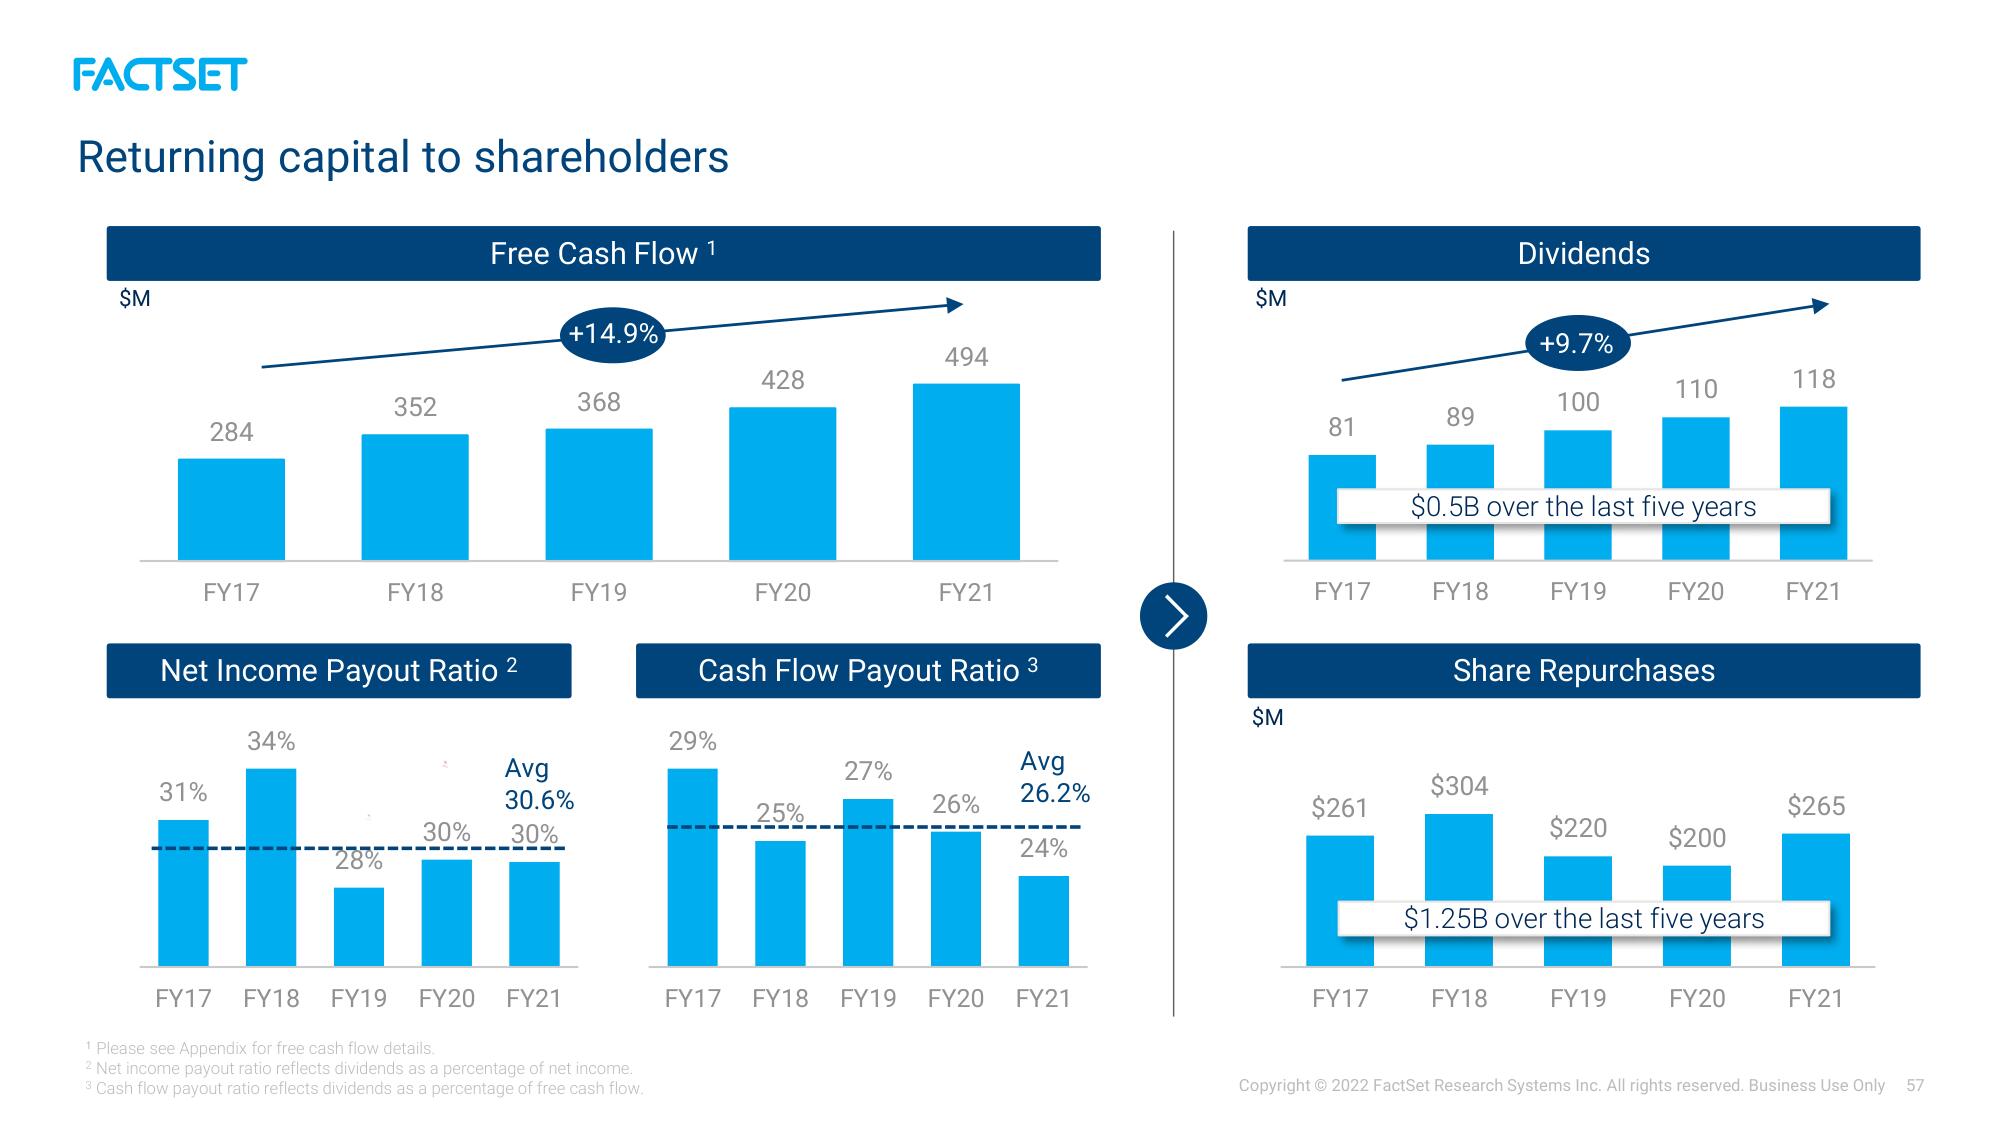
Returning capital to shareholders
$M
284
FY17
31%
34%
352
Net Income Payout Ratio ²
28%
FY18
Free Cash Flow 1
30%
+14.9%
FY17 FY18 FY19 FY20 FY21
Avg
30.6%
30%
368
FY19
1 Please see Appendix for free cash flow details.
2 Net income payout ratio reflects dividends as a percentage of net income.
13 Cash flow payout ratio reflects dividends as a percentage of free cash flow.
428
29%
FY20
Cash Flow Payout Ratio ³
25%
494
27%
FY21
26%
Avg
26.2%
24%
FY17 FY18 FY19 FY20 FY21
$M
$M
81
C
FY17
$261
L
FY17
89
FY18
Dividends
$304
+9.7%
$0.5B over the last five years
100
FY18
FY19
110
Share Repurchases
FY20
$220 $200
$1.25B over the last five years
FY19
FY20
118
FY21
$265
FY21
Copyright © 2022 FactSet Research Systems Inc. All rights reserved. Business Use Only 57View entire presentation