Barclays Investment Banking Pitch Book
Comparable Midstream Companies
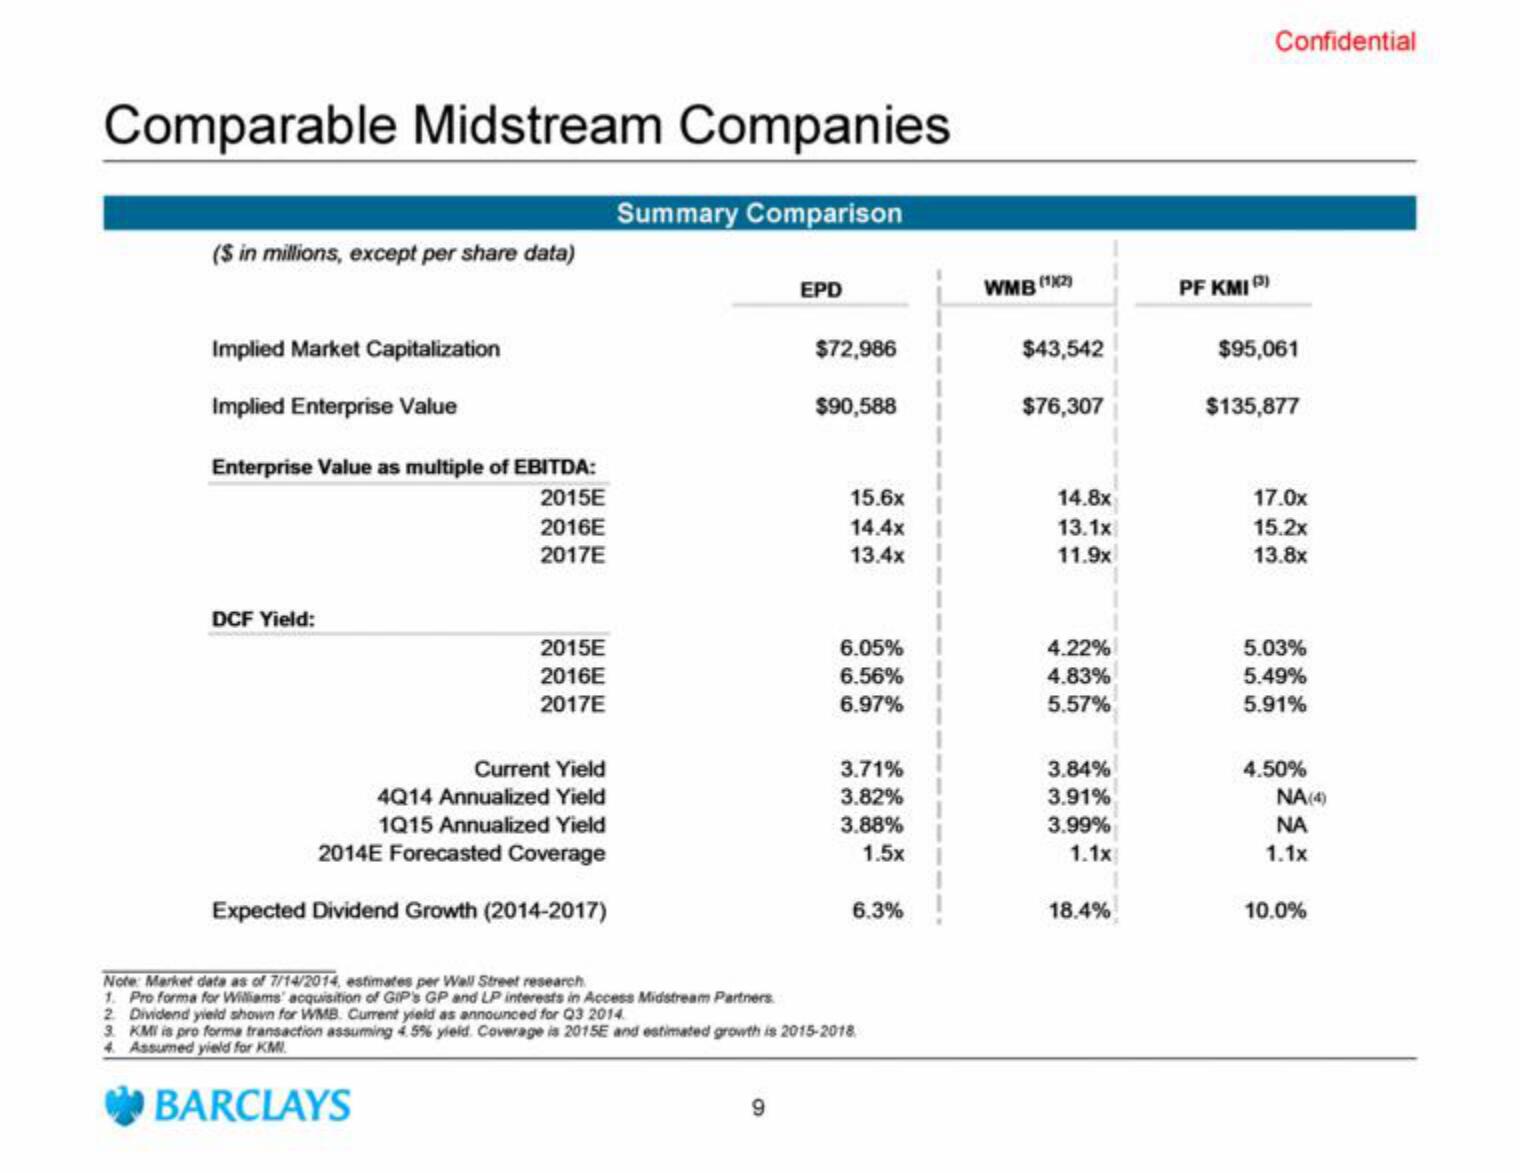
Summary Comparison
($ in millions, except per share data)
Implied Market Capitalization
Implied Enterprise Value
Enterprise Value as multiple of EBITDA:
2015E
2016E
2017E
DCF Yield:
2015E
2016E
2017E
Current Yield
4Q14 Annualized Yield
1Q15 Annualized Yield
2014E Forecasted Coverage
Expected Dividend Growth (2014-2017)
EPD
9
$72,986
$90,588
15.6x
14.4x
13.4x
6.05%
6.56%
6.97%
3.71%
3.82%
3.88%
1.5x
6.3%
Note: Market data as of 7/14/2014, estimates per Wall Street research
1. Pro forma for Williams' acquisition of GIP's GP and LP interests in Access Midstream Partners
2. Dividend yield shown for WMB. Current yield as announced for Q3 2014.
3. KMI is pro forma transaction assuming 4.5% yield. Coverage is 2015E and estimated growth is 2015-2018.
4. Assumed yield for KM
BARCLAYS
WMB (12)
$43,542
$76,307
14.8x
13.1x
11.9x
4.22%
4.83%
5.57%
3.84%
3.91%
3.99%
1.1x
18.4%
PF KMI)
Confidential
$95,061
$135,877
17.0x
15.2x
13.8x
5.03%
5.49%
5.91%
4.50%
NA (4)
ΝΑ
1.1x
10.0%View entire presentation