Confluent Investor Presentation Deck slide image

Confluent Investor Presentation Deck

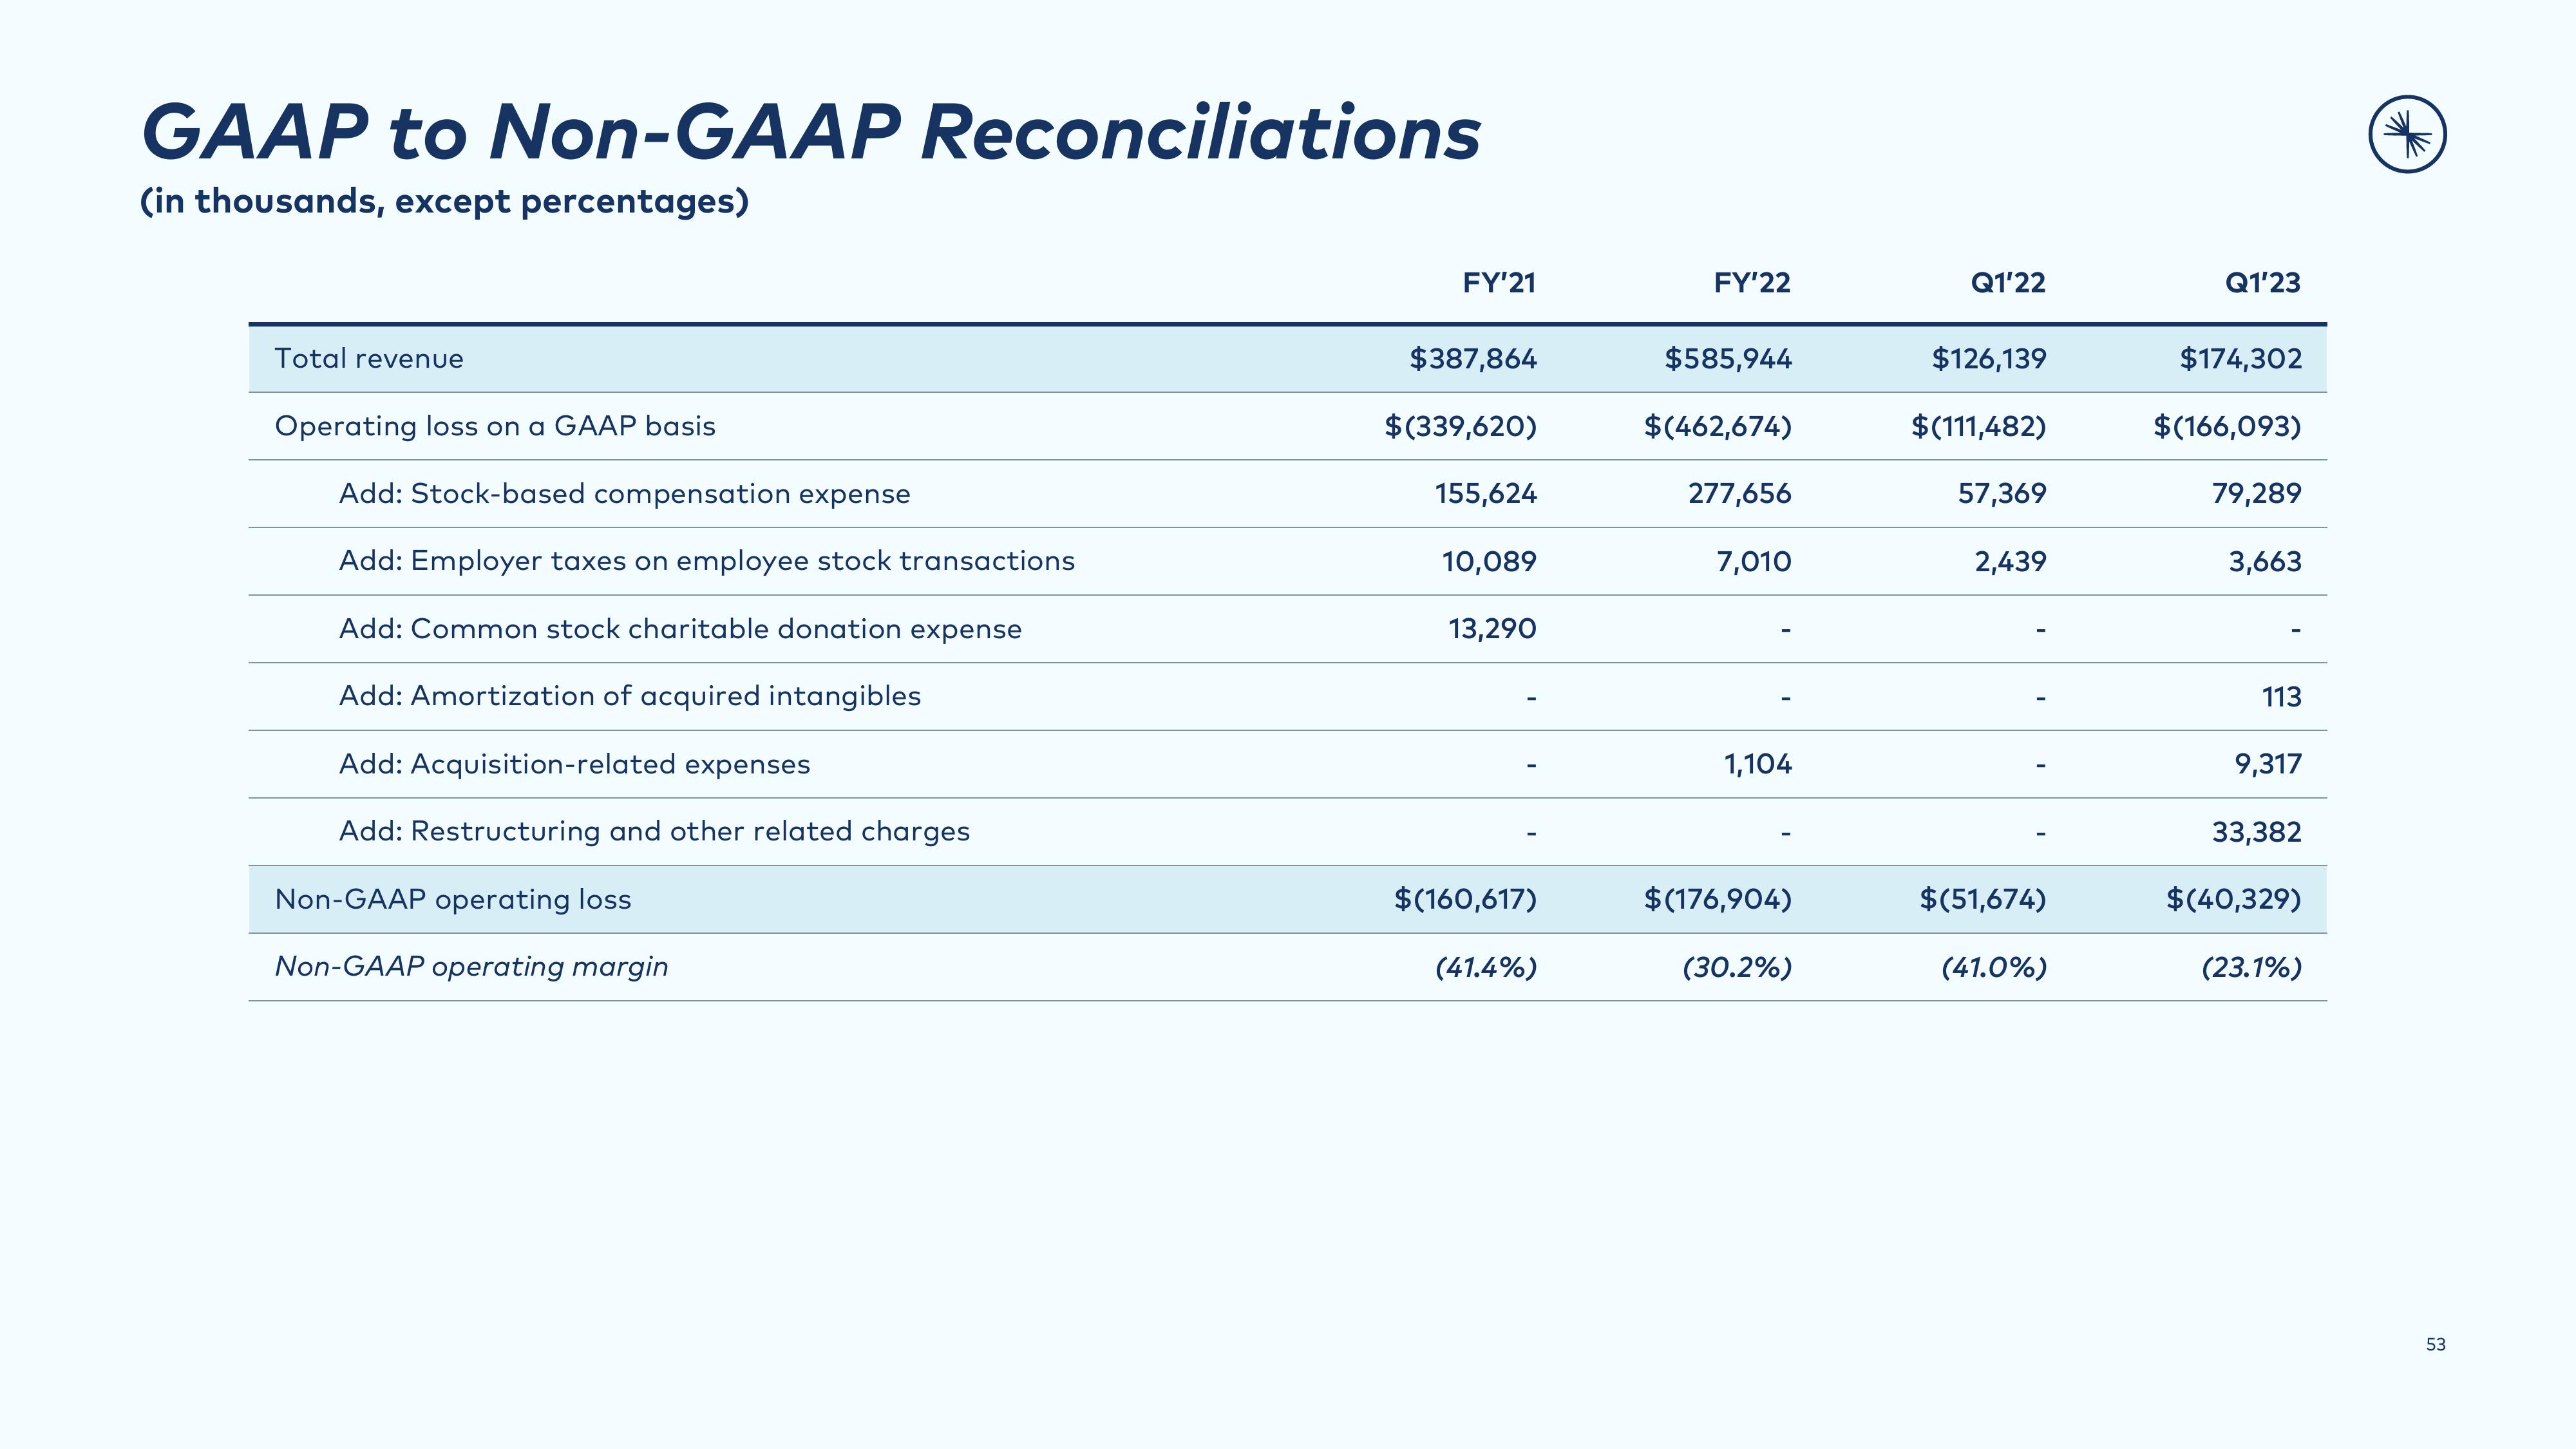
GAAP to Non-GAAP Reconciliations (in thousands, except percentages) Total revenue Operating loss on a GAAP basis Add: Stock-based compensation expense Add: Employer taxes on employee stock transactions Add: Common stock charitable donation expense Add: Amortization of acquired intangibles Add: Acquisition-related expenses Add: Restructuring and other related charges Non-GAAP operating loss Non-GAAP operating margin FY'21 $387,864 $(339,620) 155,624 10,089 13,290 $(160,617) (41.4%) FY'22 $585,944 $(462,674) 277,656 7,010 1,104 $(176,904) (30.2%) Q1'22 $126,139 $(111,482) 57,369 2,439 $(51,674) (41.0%) Q1'23 $174,302 $(166,093) 79,289 3,663 113 9,317 33,382 $(40,329) (23.1%) AN 3 53
View entire presentation