BlackRock Investor Conference Presentation Deck
Compensation expense reflects our strong performance
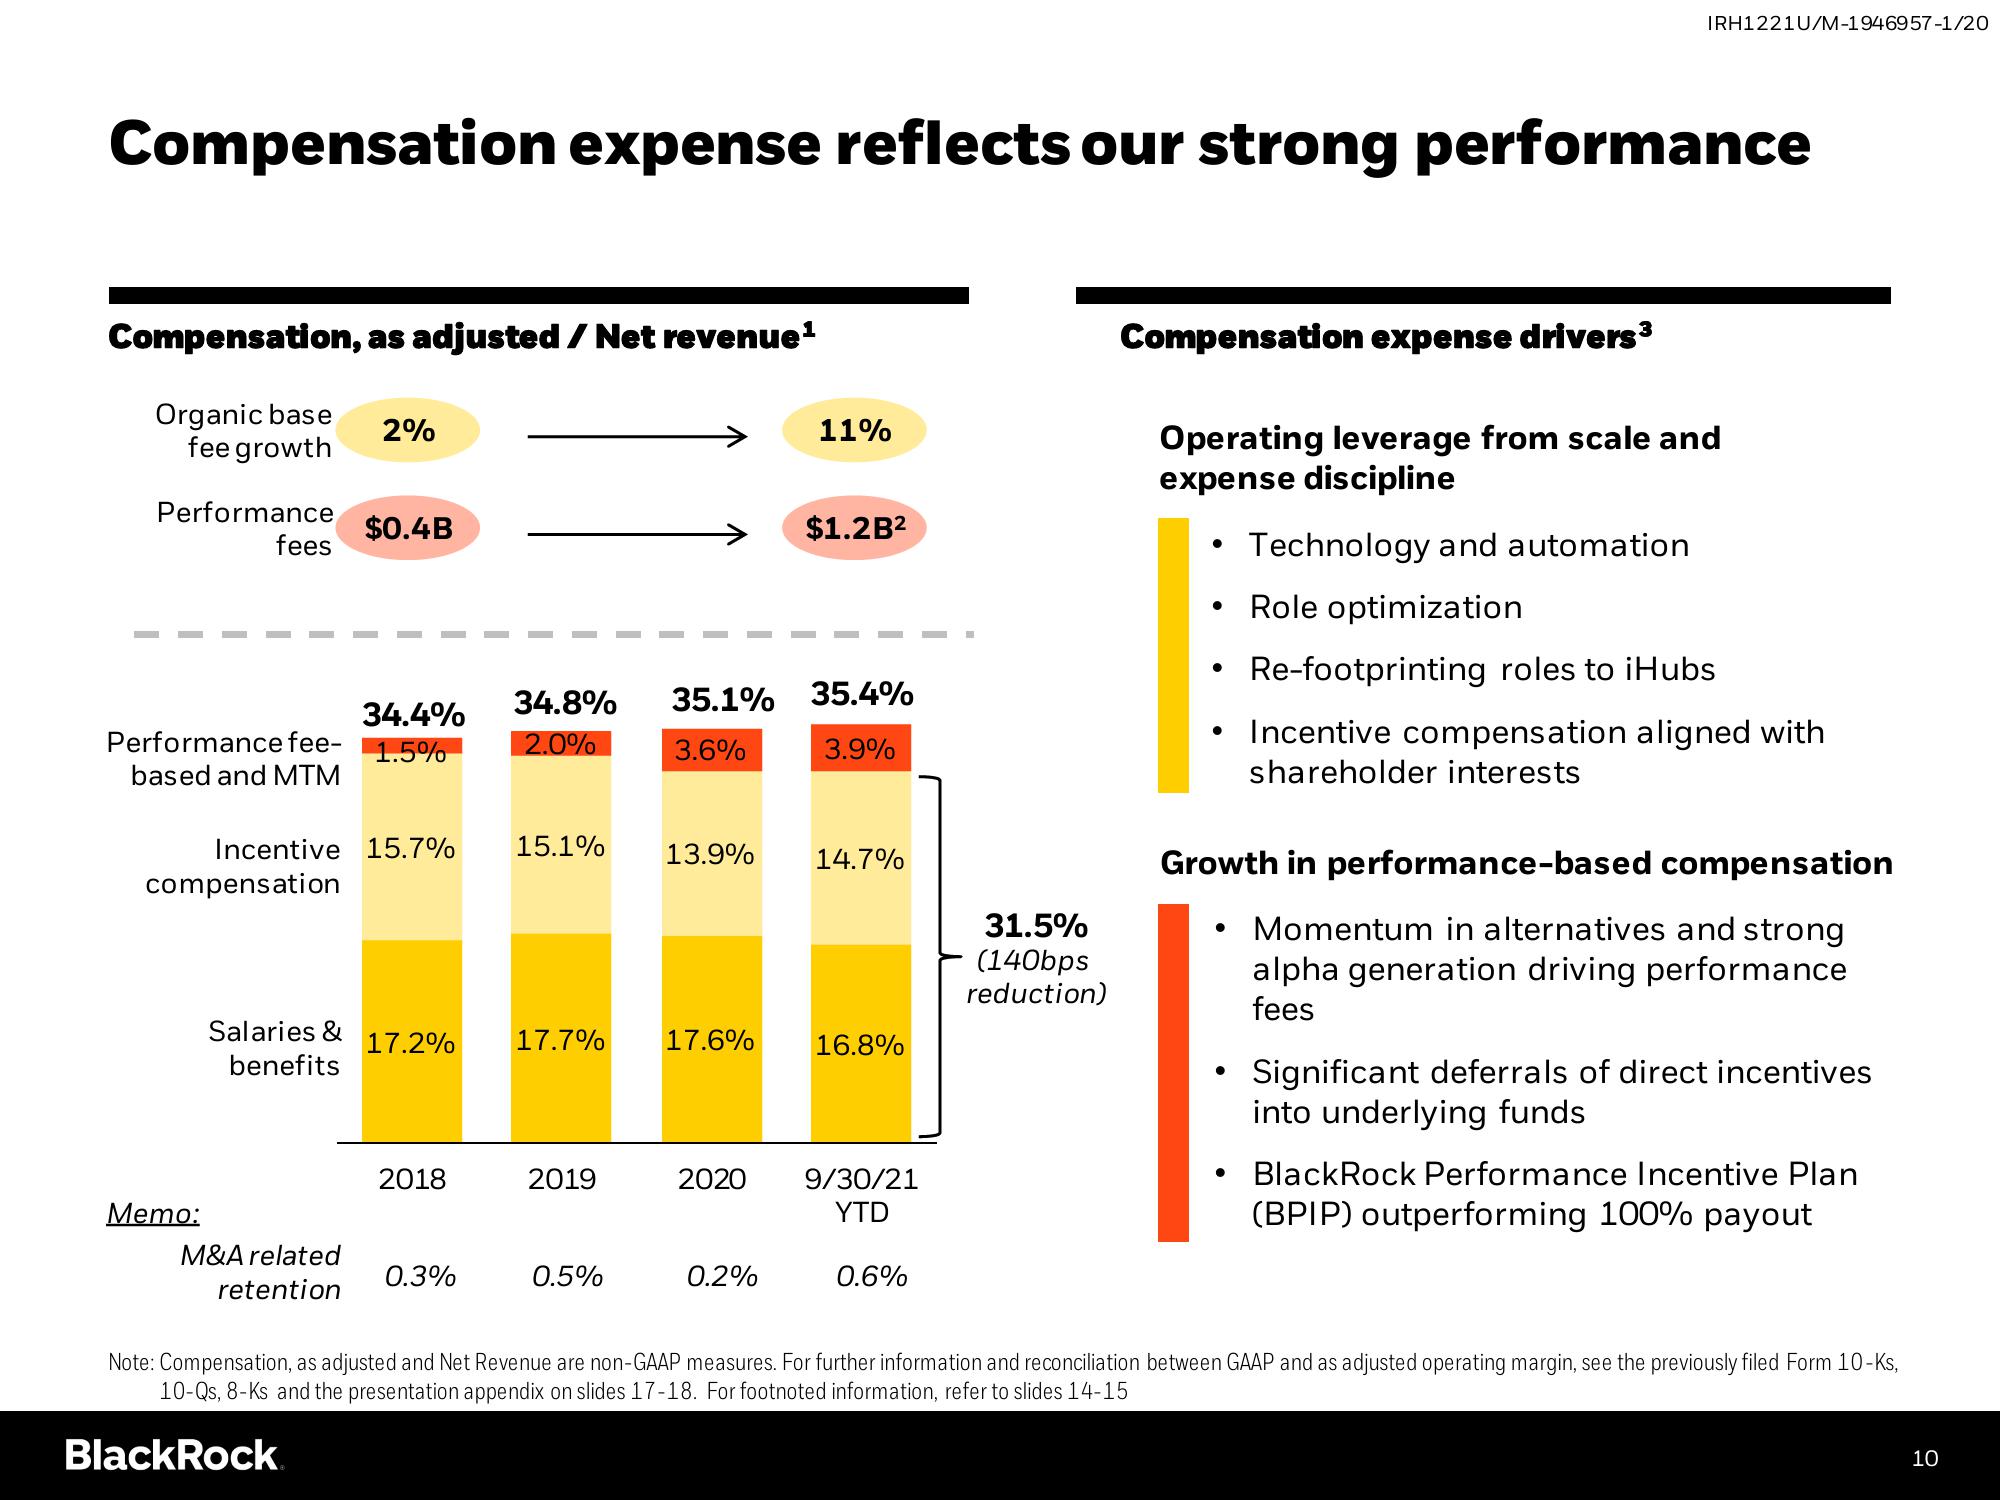
Compensation, as adjusted / Net revenue¹
Organic base
fee growth
Performance
fees
Memo:
34.4%
Performance fee- 1.5%
based and MTM
compensation
2%
Incentive 15.7%
Salaries &
benefits
$0.4B
M&A related
retention
17.2%
2018
0.3%
15.1%
34.8% 35.1% 35.4%
2.0%
3.6%
3.9%
17.7%
2019
0.5%
13.9%
17.6%
11%
$1.2B²
0.2%
14.7%
16.8%
2020 9/30/21
YTD
0.6%
31.5%
(140bps
reduction)
Compensation expense drivers ³
Operating leverage from scale and
expense discipline
Technology and automation
• Role optimization
●
●
IRH1221U/M-1946957-1/20
●
Growth in performance-based compensation
Momentum in alternatives and strong
alpha generation driving performance
fees
●
Re-footprinting roles to iHubs
Incentive compensation aligned with
shareholder interests
Significant deferrals of direct incentives
into underlying funds
BlackRock Performance Incentive Plan
(BPIP) outperforming 100% payout
Note: Compensation, as adjusted and Net Revenue are non-GAAP measures. For further information and reconciliation between GAAP and as adjusted operating margin, see the previously filed Form 10-Ks,
10-Qs, 8-Ks and the presentation appendix on slides 17-18. For footnoted information, refer to slides 14-15
BlackRock
10View entire presentation