IGI SPAC Presentation Deck
3 Disciplined Risk Selection and Prudent Risk Management Framework
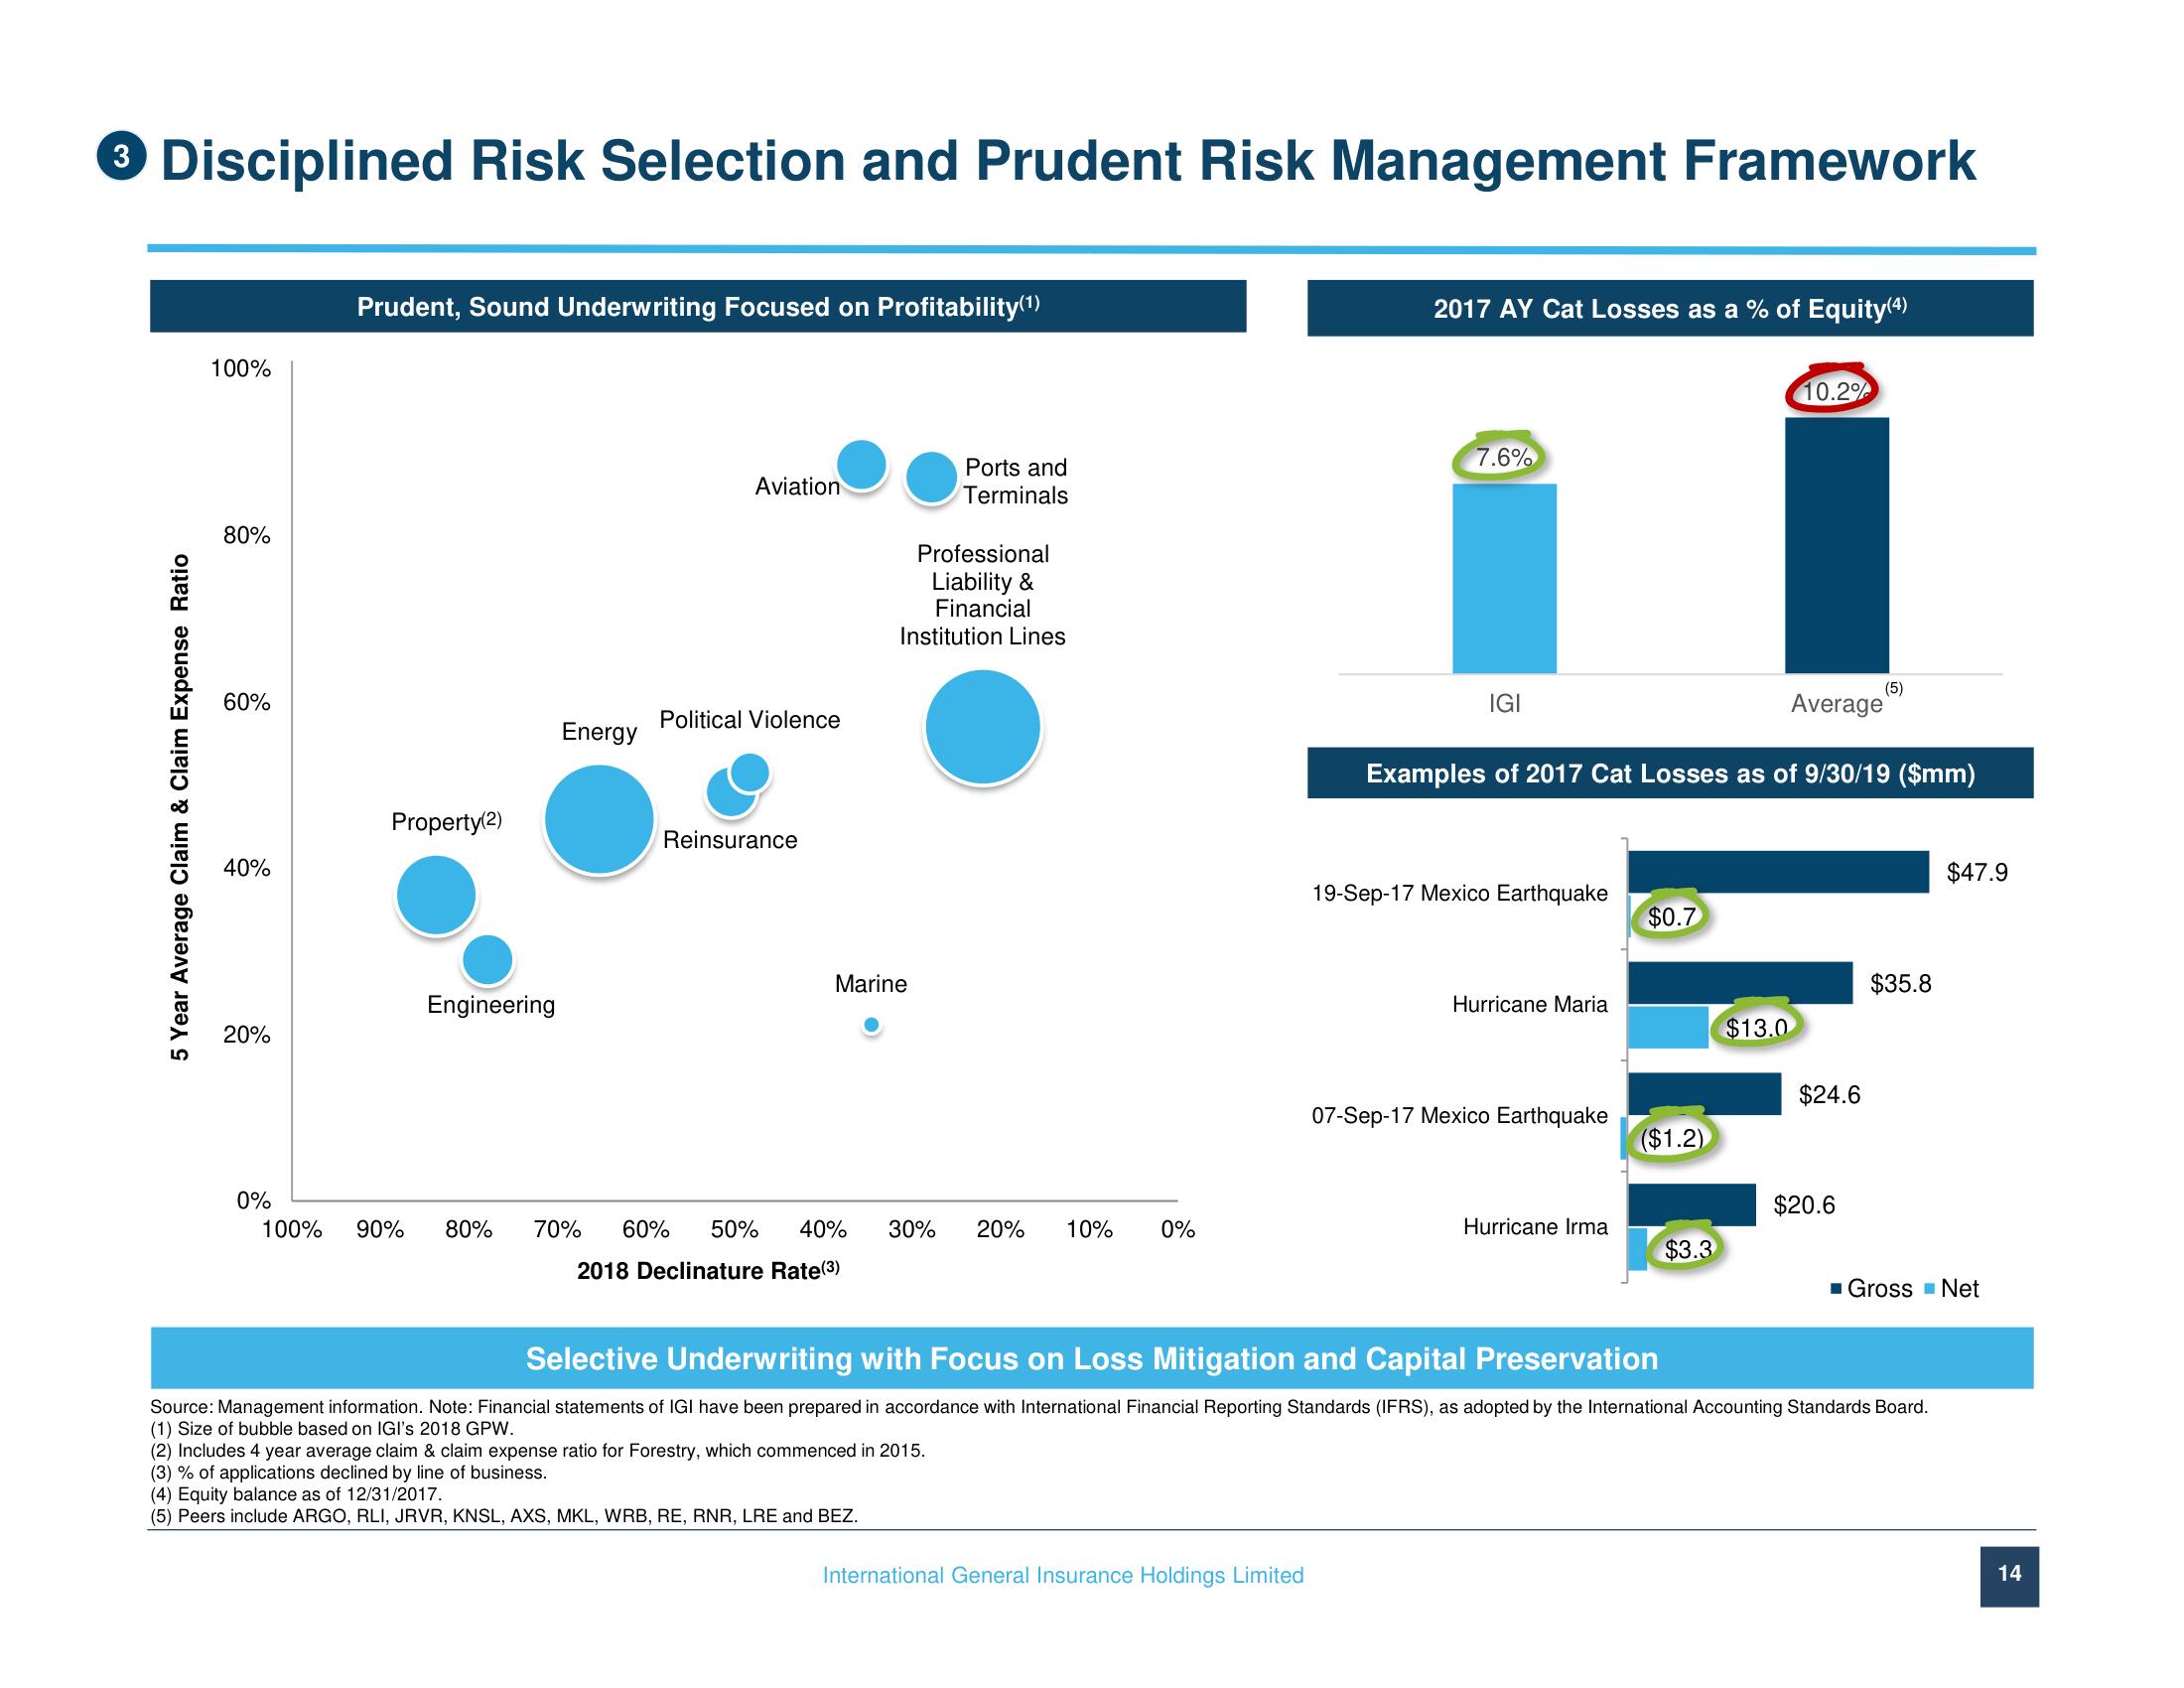
5 Year Average Claim & Claim Expense Ratio
100%
80%
60%
40%
20%
0%
Prudent, Sound Underwriting Focused on Profitability(¹)
Property(2)
Engineering
100% 90% 80%
Energy
Aviation
Political Violence
Reinsurance
Professional
Liability &
Financial
Institution Lines
Marine
Ports and
Terminals
70% 60% 50% 40% 30% 20% 10% 0%
2018 Declinature Rate(³)
(2) Includes 4 year average claim & claim expense ratio for Forestry, which commenced in 2015.
(3) % of applications declined by line of business.
(4) Equity balance as of 12/31/2017.
(5) Peers include ARGO, RLI, JRVR, KNSL, AXS, MKL, WRB, RE, RNR, LRE and BEZ.
2017 AY Cat Losses as a % of Equity(4)
International General Insurance Holdings Limited
7.6%
IGI
19-Sep-17 Mexico Earthquake
Average
Examples of 2017 Cat Losses as of 9/30/19 ($mm)
Hurricane Maria
07-Sep-17 Mexico Earthquake
Hurricane Irma
$0.7
($1.2)
$3.3
10.2%
$13.0
$24.6
(5)
$20.6
$35.8
Selective Underwriting with Focus on Loss Mitigation and Capital Preservation
Source: Management information. Note: Financial statements of IGI have been prepared in accordance with International Financial Reporting Standards (IFRS), as adopted by the International Accounting Standards Board.
(1) Size of bubble based on IGI's 2018 GPW.
$47.9
■ Gross Net
14View entire presentation