Foxo SPAC Presentation Deck
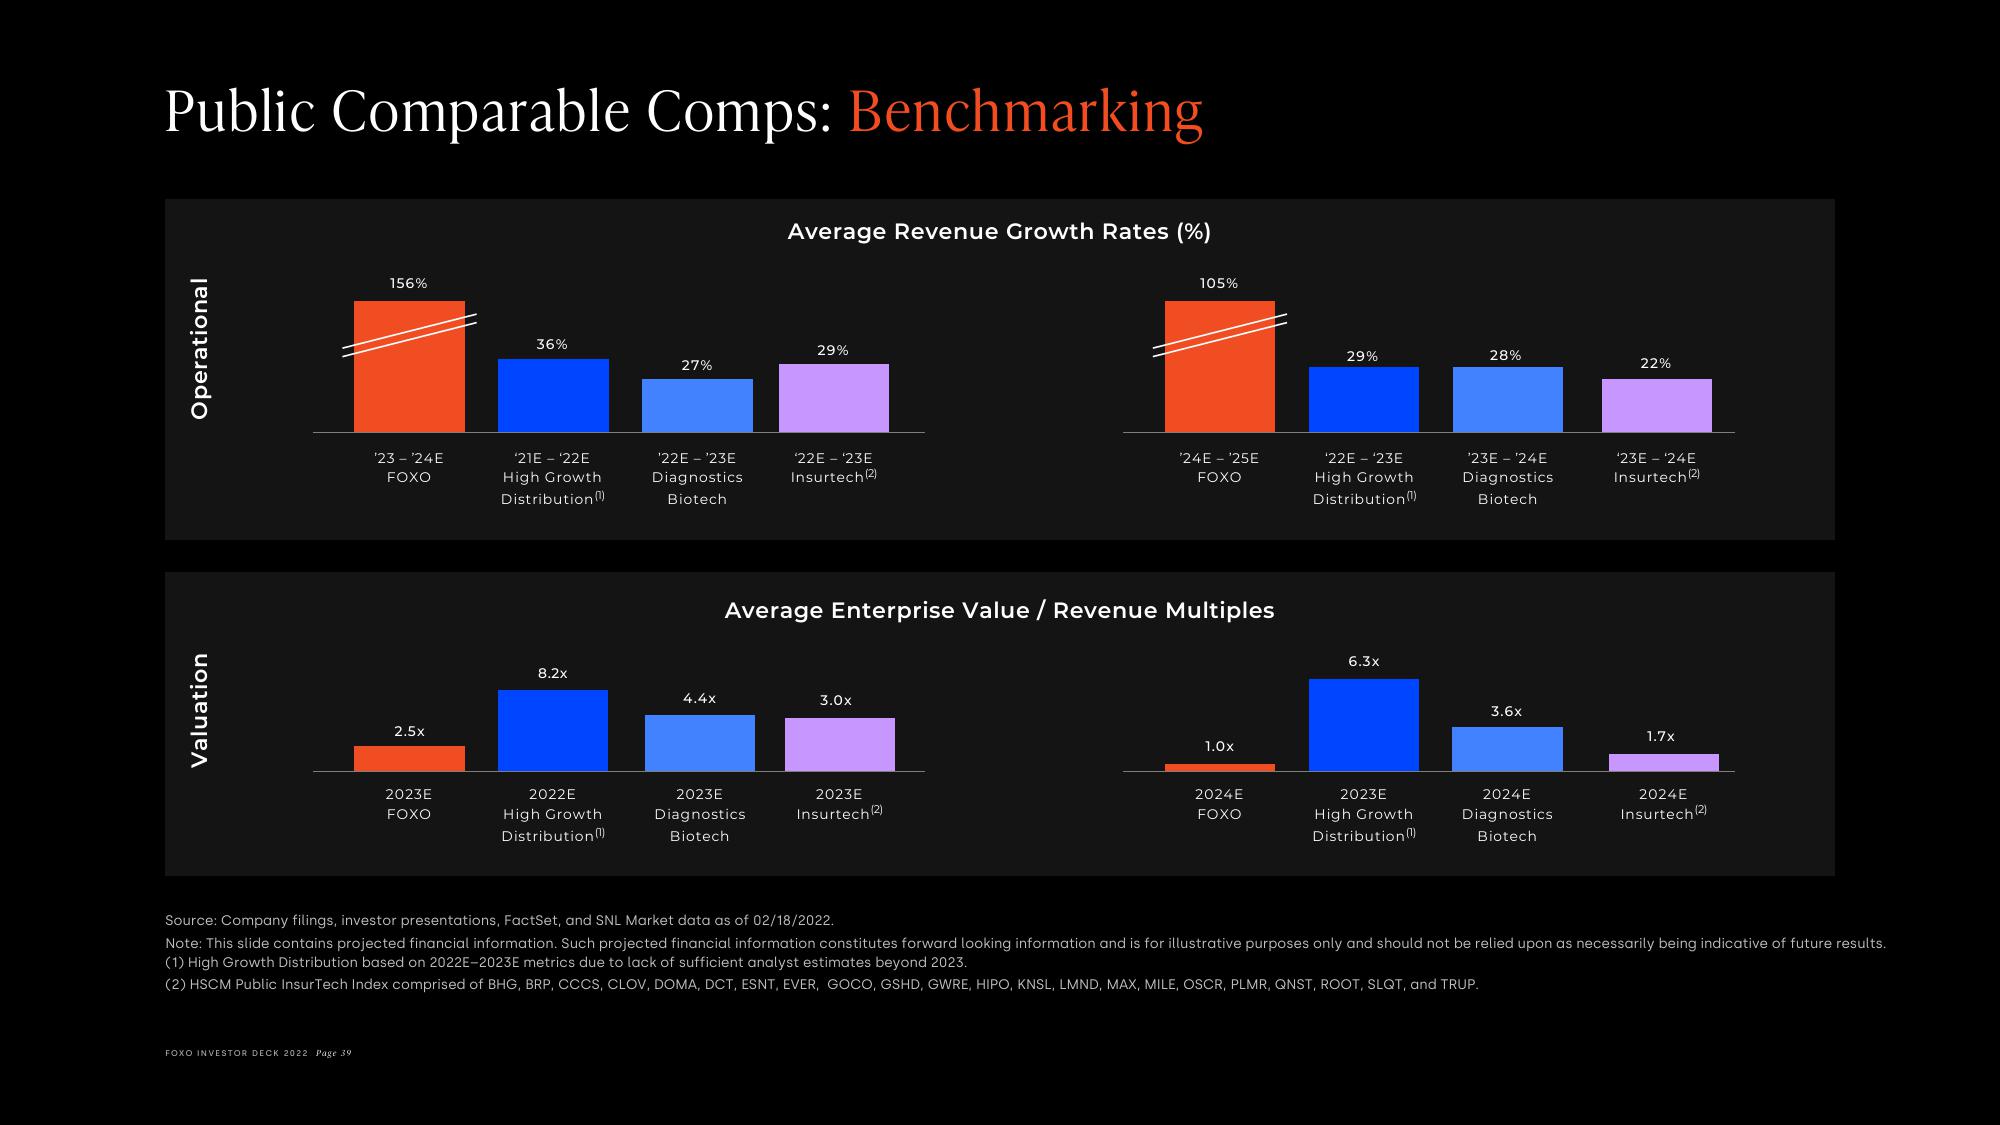
Public Comparable Comps: Benchmarking
Operational
Valuation
156%
FOXO INVESTOR DECK 2022 Page 39
'23-24E
FOXO
2.5x
2023E
FOXO
36%
'21E - ¹22E
High Growth
Distribution (¹)
8,2x
2022E
High Growth
Distribution)
27%
¹22E-¹23E
Diagnostics
Biotech
4.4X
Average Revenue Growth Rates (%)
2023E
Diagnostics
Biotech
29%
'22E - ¹23E
Insurtech (2)
Average Enterprise Value / Revenue Multiples
3.0x
105%
2023E
Insurtech (2)
$24E-¹25E
FOXO
1.0x
2024E
FOXO
29%
'22E - ¹23E
High Growth
Distribution (¹)
6.3x
2023E
High Growth
Distribution)
28%
¹23E-¹24E
Diagnostics
Biotech
3.6x
2024E
Diagnostics
Biotech
22%
'23E - 24E
Insurtech (2)
1.7x
2024E
Insurtech (2)
Source: Company filings, investor presentations, FactSet, and SNL Market data as of 02/18/2022.
Note: This slide contains projected financial information. Such projected financial information constitutes forward looking information and is for illustrative purposes only and should not be relied upon as necessarily being indicative of future results.
(1) High Growth Distribution based on 2022E-2023E metrics due to lack of sufficient analyst estimates beyond 2023.
(2) HSCM Public InsurTech Index comprised of BHG, BRP, CCCS, CLOV, DOMA, DCT, ESNT, EVER, GOCO, GSHD, GWRE, HIPO, KNSL, LMND, MAX, MILE, OSCR, PLMR, QNST, ROOT, SLQT, and TRUP.View entire presentation