TPG Investor Presentation Deck
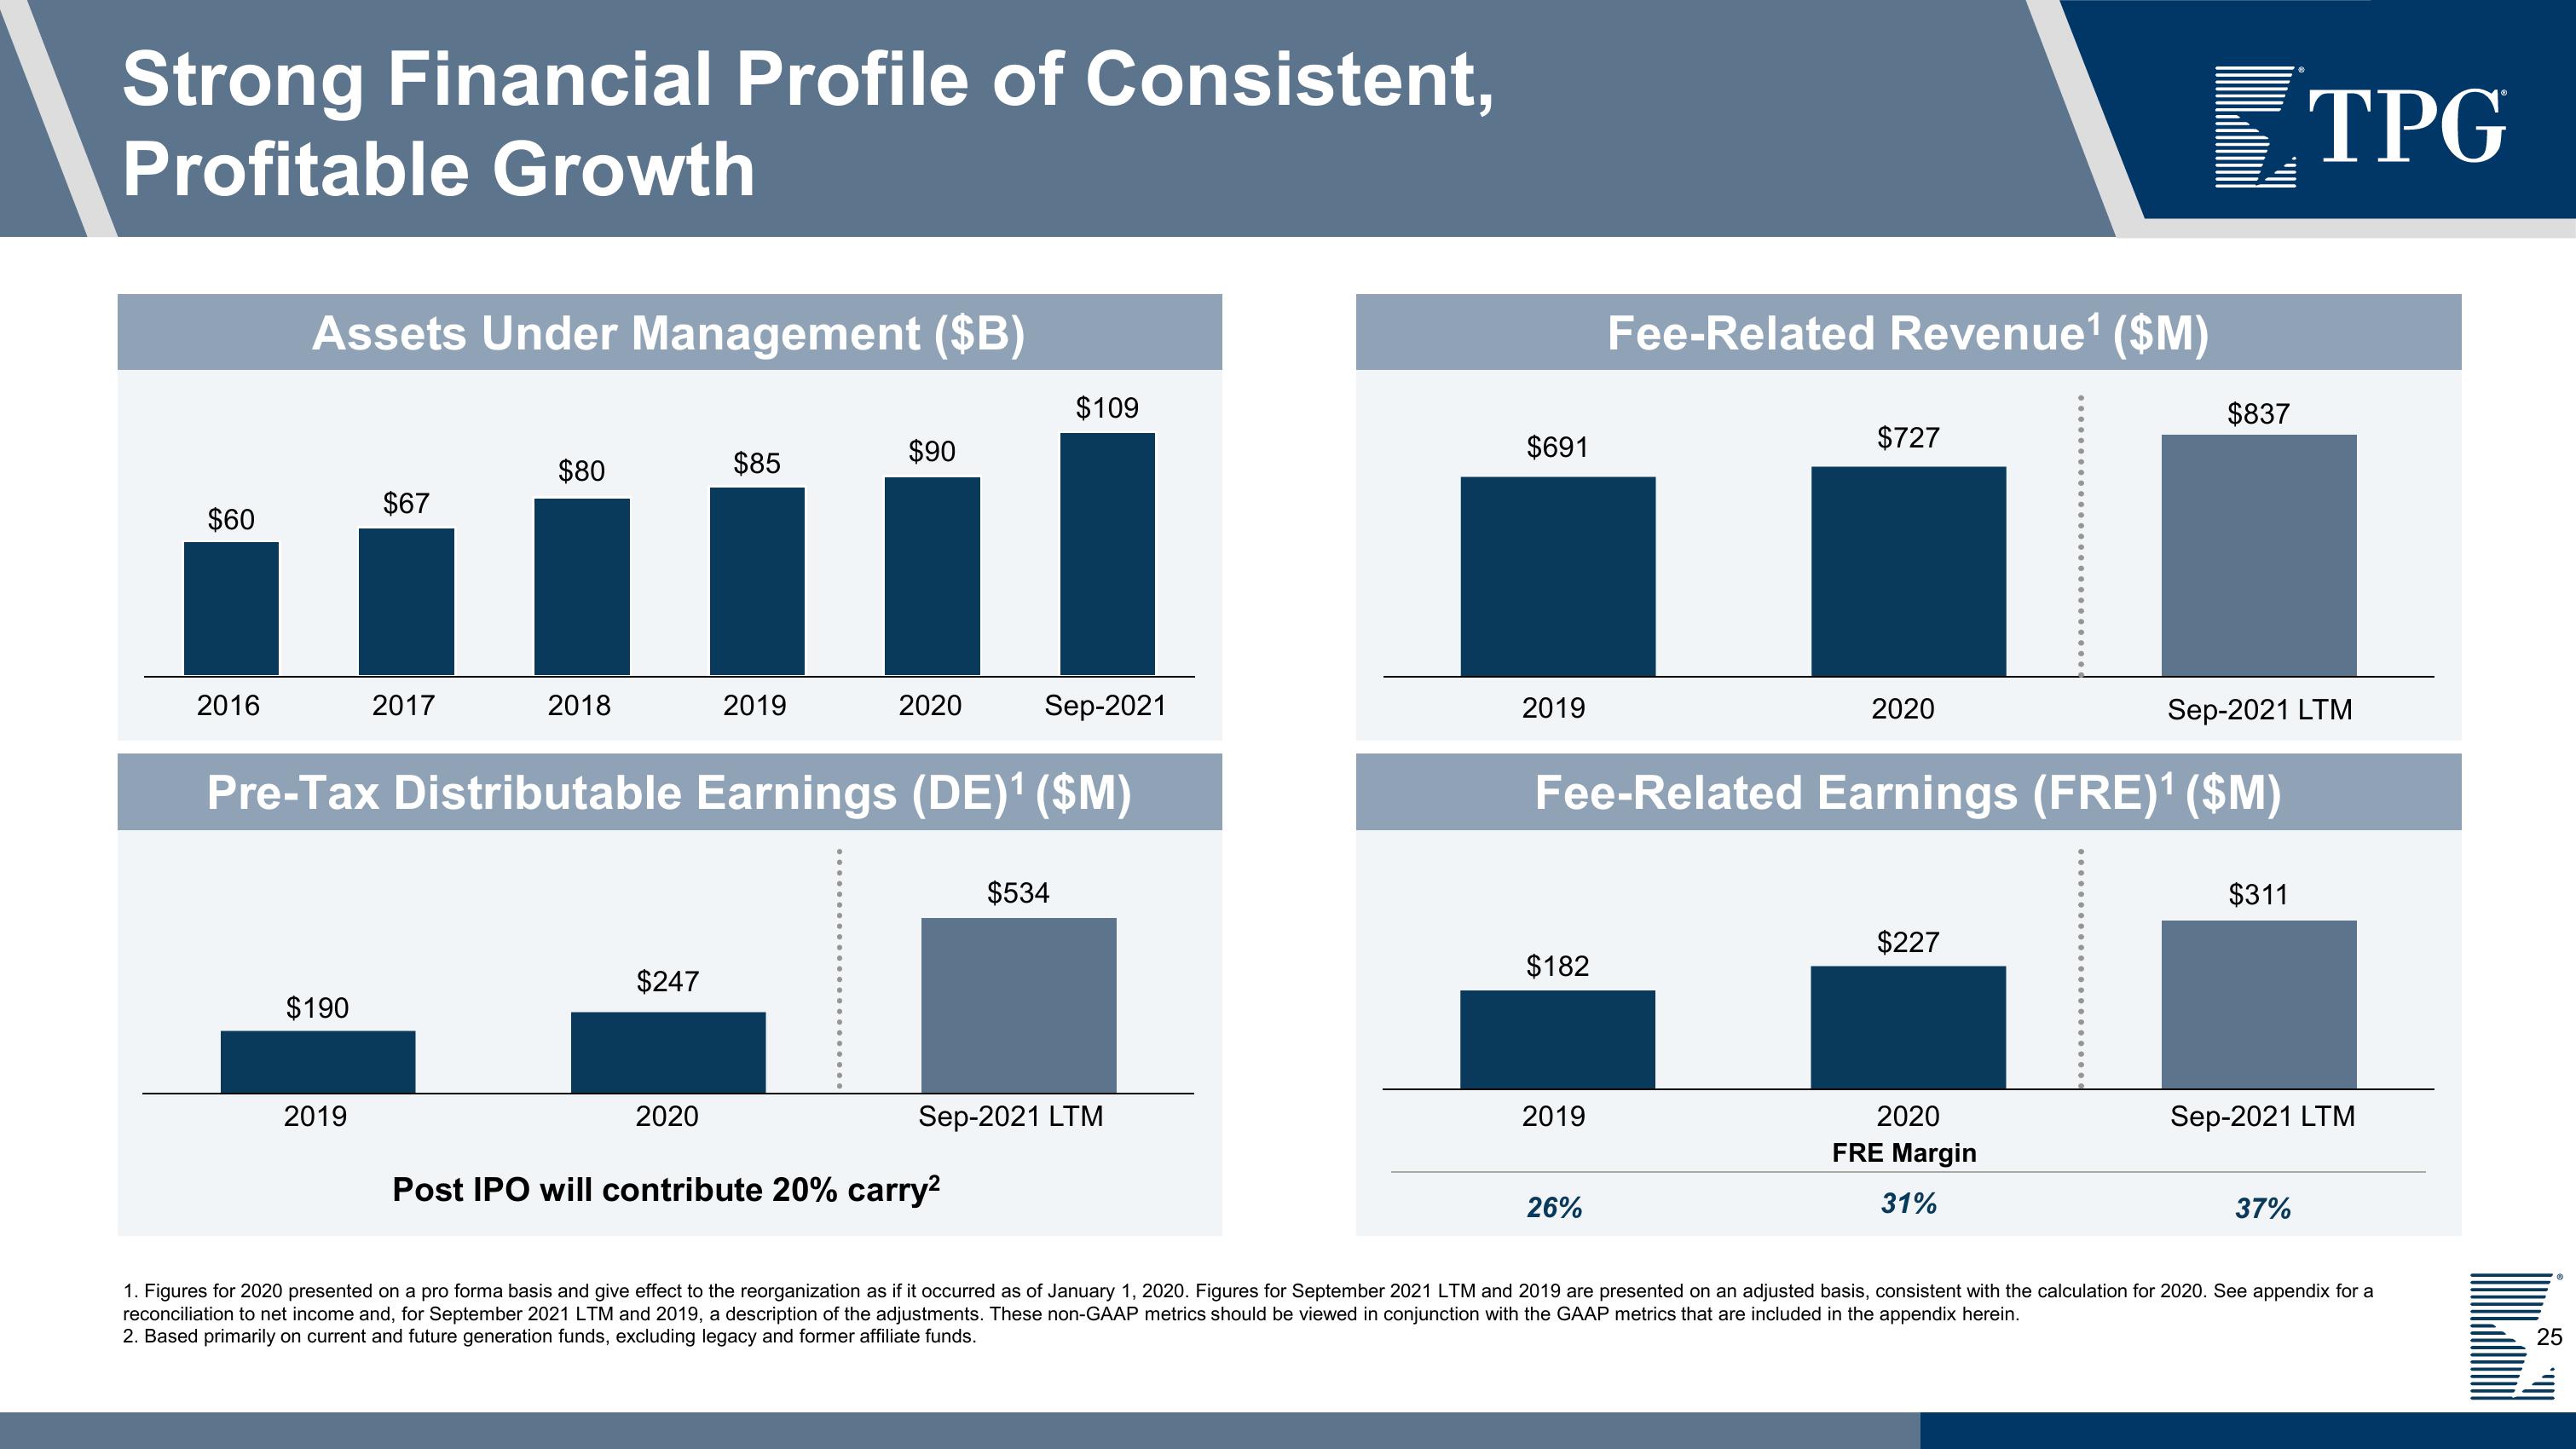
Strong Financial Profile of Consistent,
Profitable Growth
$60
Assets Under Management ($B)
2016
$190
$67
2019
$80
2017
2020 Sep-2021
Pre-Tax Distributable Earnings (DE)¹ ($M)
2018
$247
$85
2020
$90
2019
$109
$534
Post IPO will contribute 20% carry²
Sep-2021 LTM
$691
2019
$182
2019
Fee-Related Revenue¹ ($M)
26%
$727
2020
Sep-2021 LTM
Fee-Related Earnings (FRE)¹ ($M)
$227
$837
2020
FRE Margin
31%
$311
TPG
Sep-2021 LTM
37%
1. Figures for 2020 presented on a pro forma basis and give effect to the reorganization as if it occurred as of January 1, 2020. Figures for September 2021 LTM and 2019 are presented on an adjusted basis, consistent with the calculation for 2020. See appendix for a
reconciliation to net income and, for September 2021 LTM and 2019, a description of the adjustments. These non-GAAP metrics should be viewed in conjunction with the GAAP metrics that are included in the appendix herein.
2. Based primarily on current and future generation funds, excluding legacy and former affiliate funds.
25View entire presentation