Benson Hill Results Presentation Deck
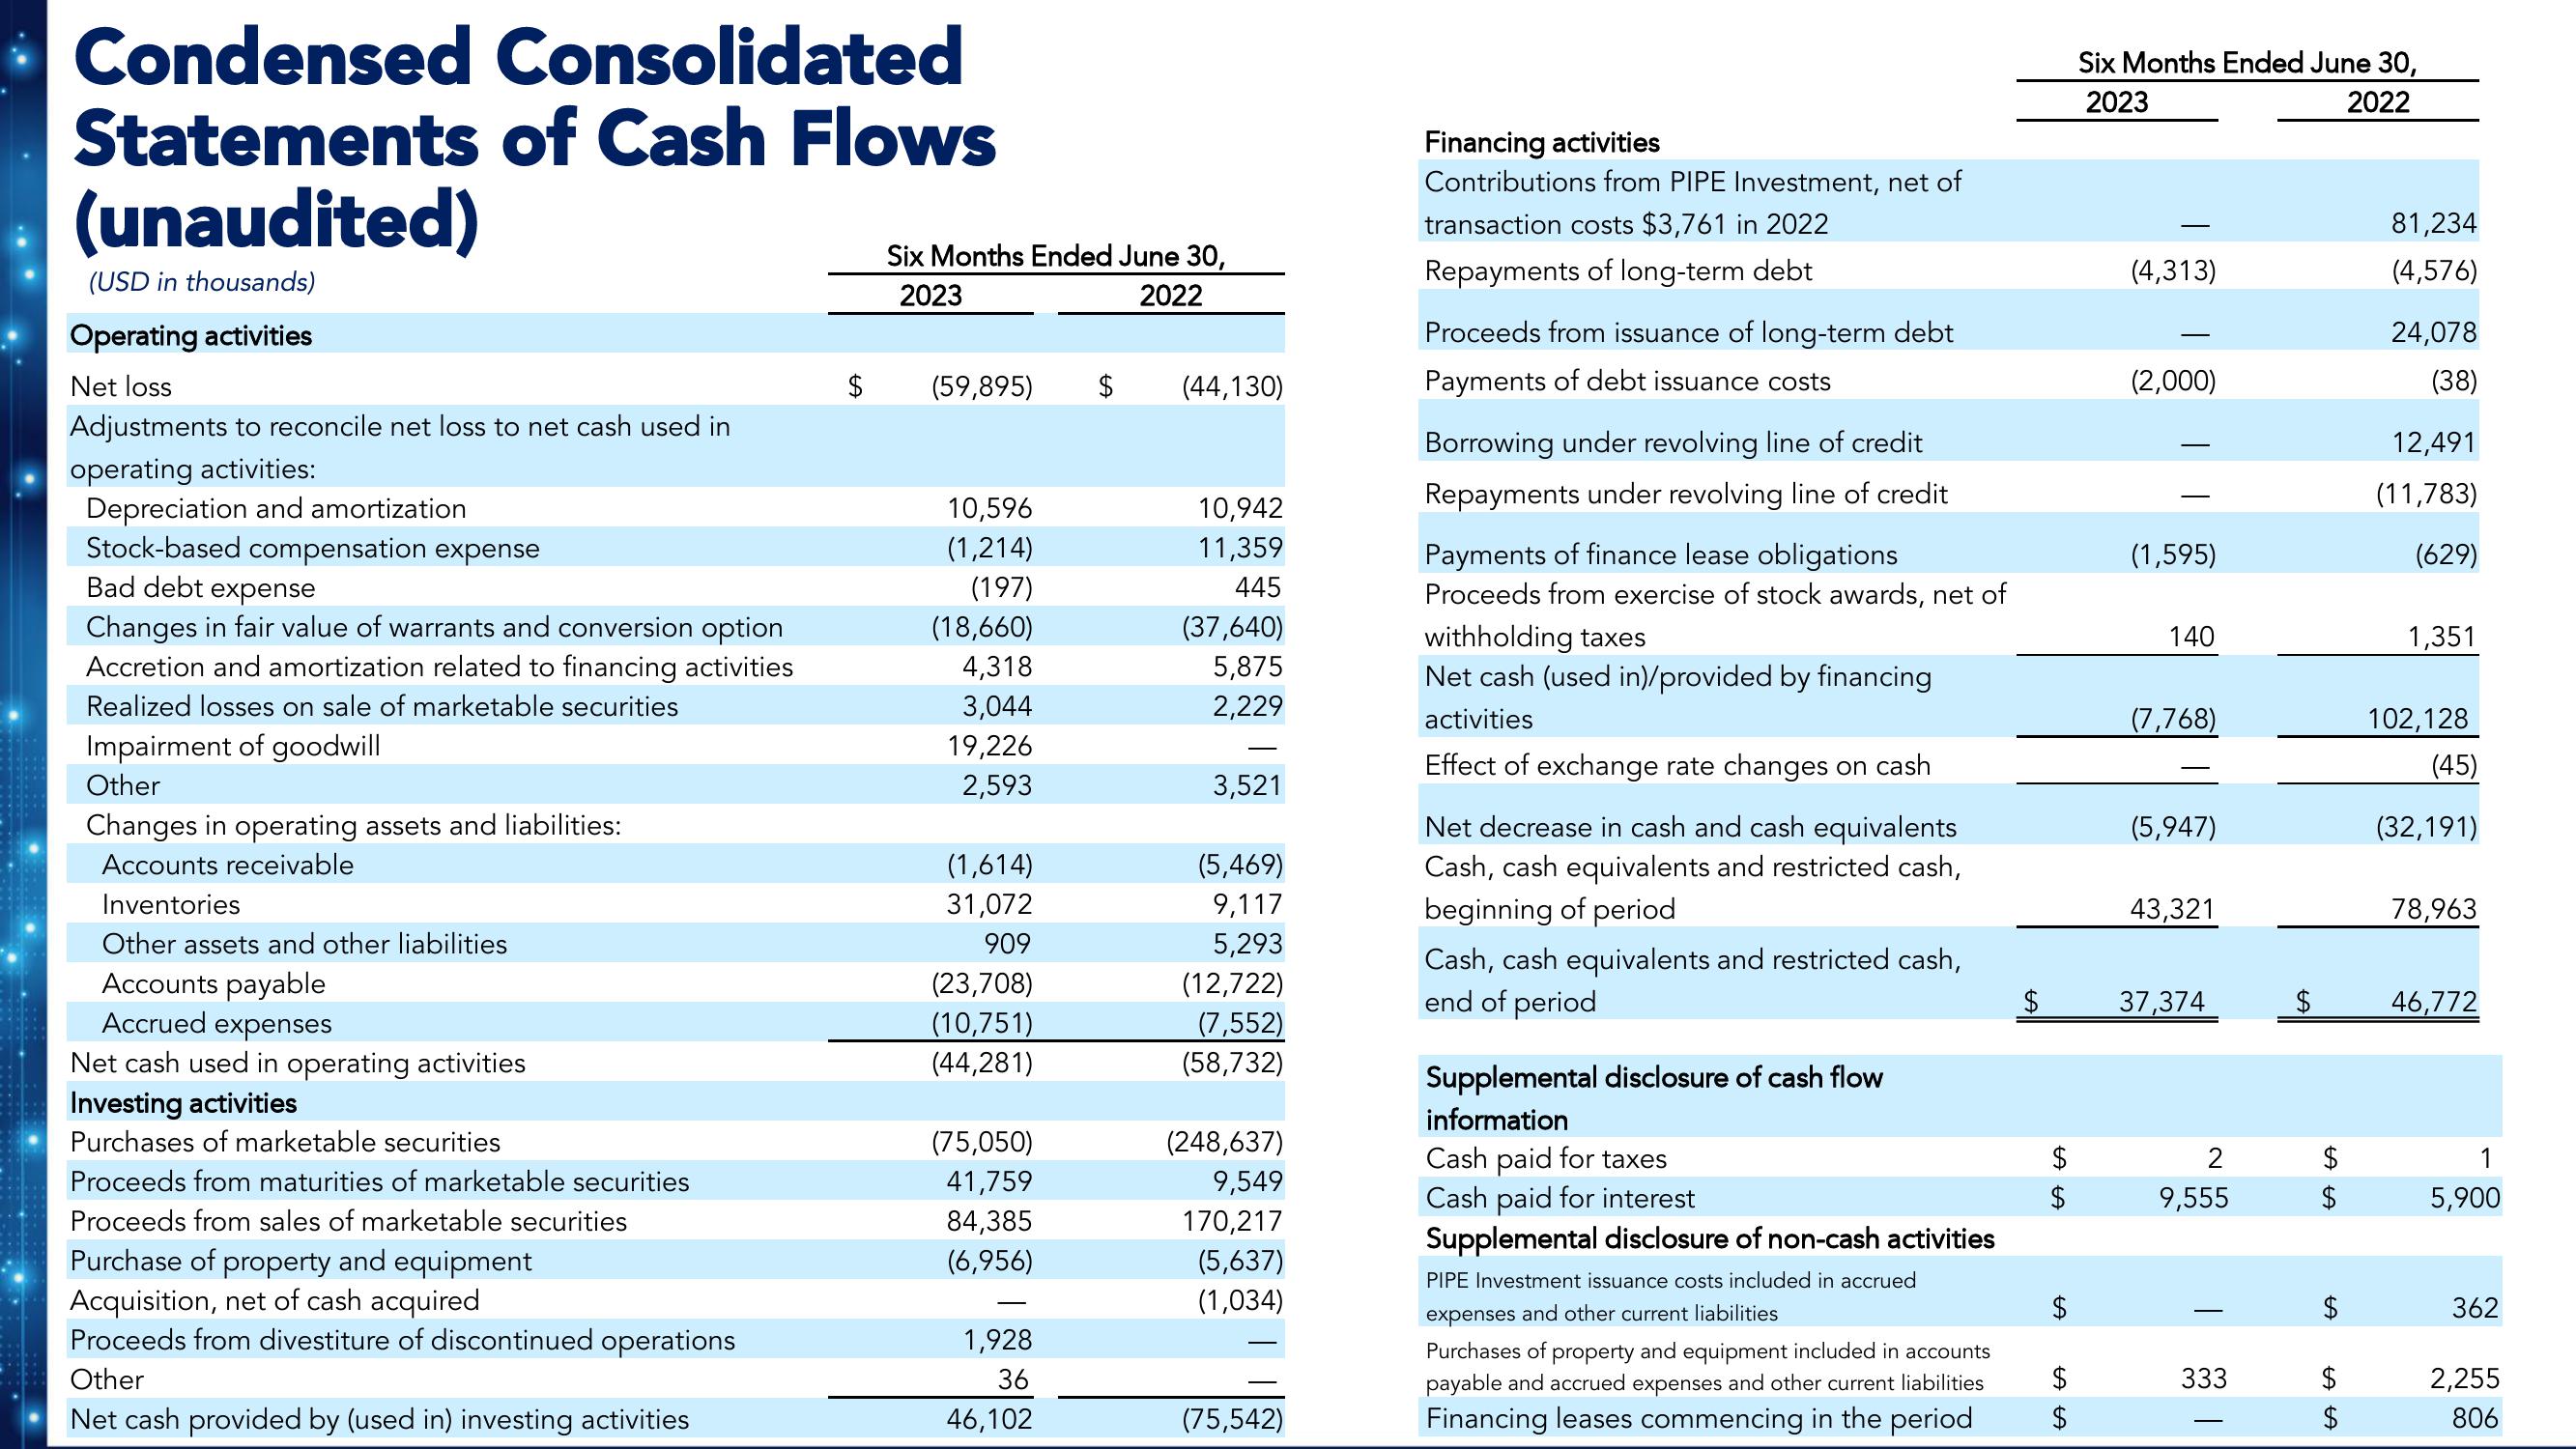
Condensed Consolidated
of Cash Flows
Statements
(unaudited)
(USD in thousands)
Operating activities
Net loss
Adjustments to reconcile net loss to net cash used in
operating activities:
Depreciation and amortization
Stock-based compensation expense
Bad debt expense
Changes in fair value of warrants and conversion option
Accretion and amortization related to financing activities
Realized losses on sale of marketable securities
Impairment of goodwill
Other
Changes in operating assets and liabilities:
Accounts receivable
Inventories
Other assets and other liabilities
Accounts payable
Accrued expenses
Net cash used in operating activities
Investing activities
Purchases of marketable securities
Proceeds from maturities of marketable securities
Proceeds from sales of marketable securities
Purchase of property and equipment
Acquisition, net of cash acquired
Proceeds from divestiture of discontinued operations
Other
Net cash provided by (used in) investing activities
$
Six Months Ended June 30,
2023
2022
(59,895)
10,596
(1,214)
(197)
(18,660)
4,318
3,044
19,226
2,593
(1,614)
31,072
909
(23,708)
(10,751)
(44,281)
(75,050)
41,759
84,385
(6,956)
1,928
36
46,102
$
(44,130)
10,942
11,359
445
(37,640)
5,875
2,229
3,521
(5,469)
9,117
5,293
(12,722)
(7,552)
(58,732)
(248,637)
9,549
170,217
(5,637)
(1,034)
(75,542)
Financing activities
Contributions from PIPE Investment, net of
transaction costs $3,761 in 2022
Repayments of long-term debt
Proceeds from issuance of long-term debt
Payments of debt issuance costs
Borrowing under revolving line of credit
Repayments under revolving line of credit
Payments of finance lease obligations
Proceeds from exercise of stock awards, net of
withholding taxes
Net cash (used in)/provided by financing
activities
Effect of exchange rate changes on cash
Net decrease in cash and cash equivalents
Cash, cash equivalents and restricted cash,
beginning of period
Cash, cash equivalents and restricted cash,
end of period
Supplemental disclosure of cash flow
information
Cash paid for taxes
Cash paid for interest
Supplemental disclosure of non-cash activities
PIPE Investment issuance costs included in accrued
expenses and other current liabilities
Purchases of property and equipment included in accounts
payable and accrued expenses and other current liabilities
Financing leases commencing in the period
$
LA LA
$
LA
LA LA
$
$
Six Months Ended June 30,
2023
2022
(4,313)
(2,000)
(1,595)
140
(7,768)
(5,947)
43,321
37,374
2
9,555
333
$
LA LA
$
LA
LA LA
$
$
81,234
(4,576)
24,078
(38)
12,491
(11,783)
(629)
1,351
102,128
(45)
(32,191)
78,963
46,772
1
5,900
362
2,255
806View entire presentation