Hyzon SPAC Presentation Deck slide image

Hyzon SPAC Presentation Deck

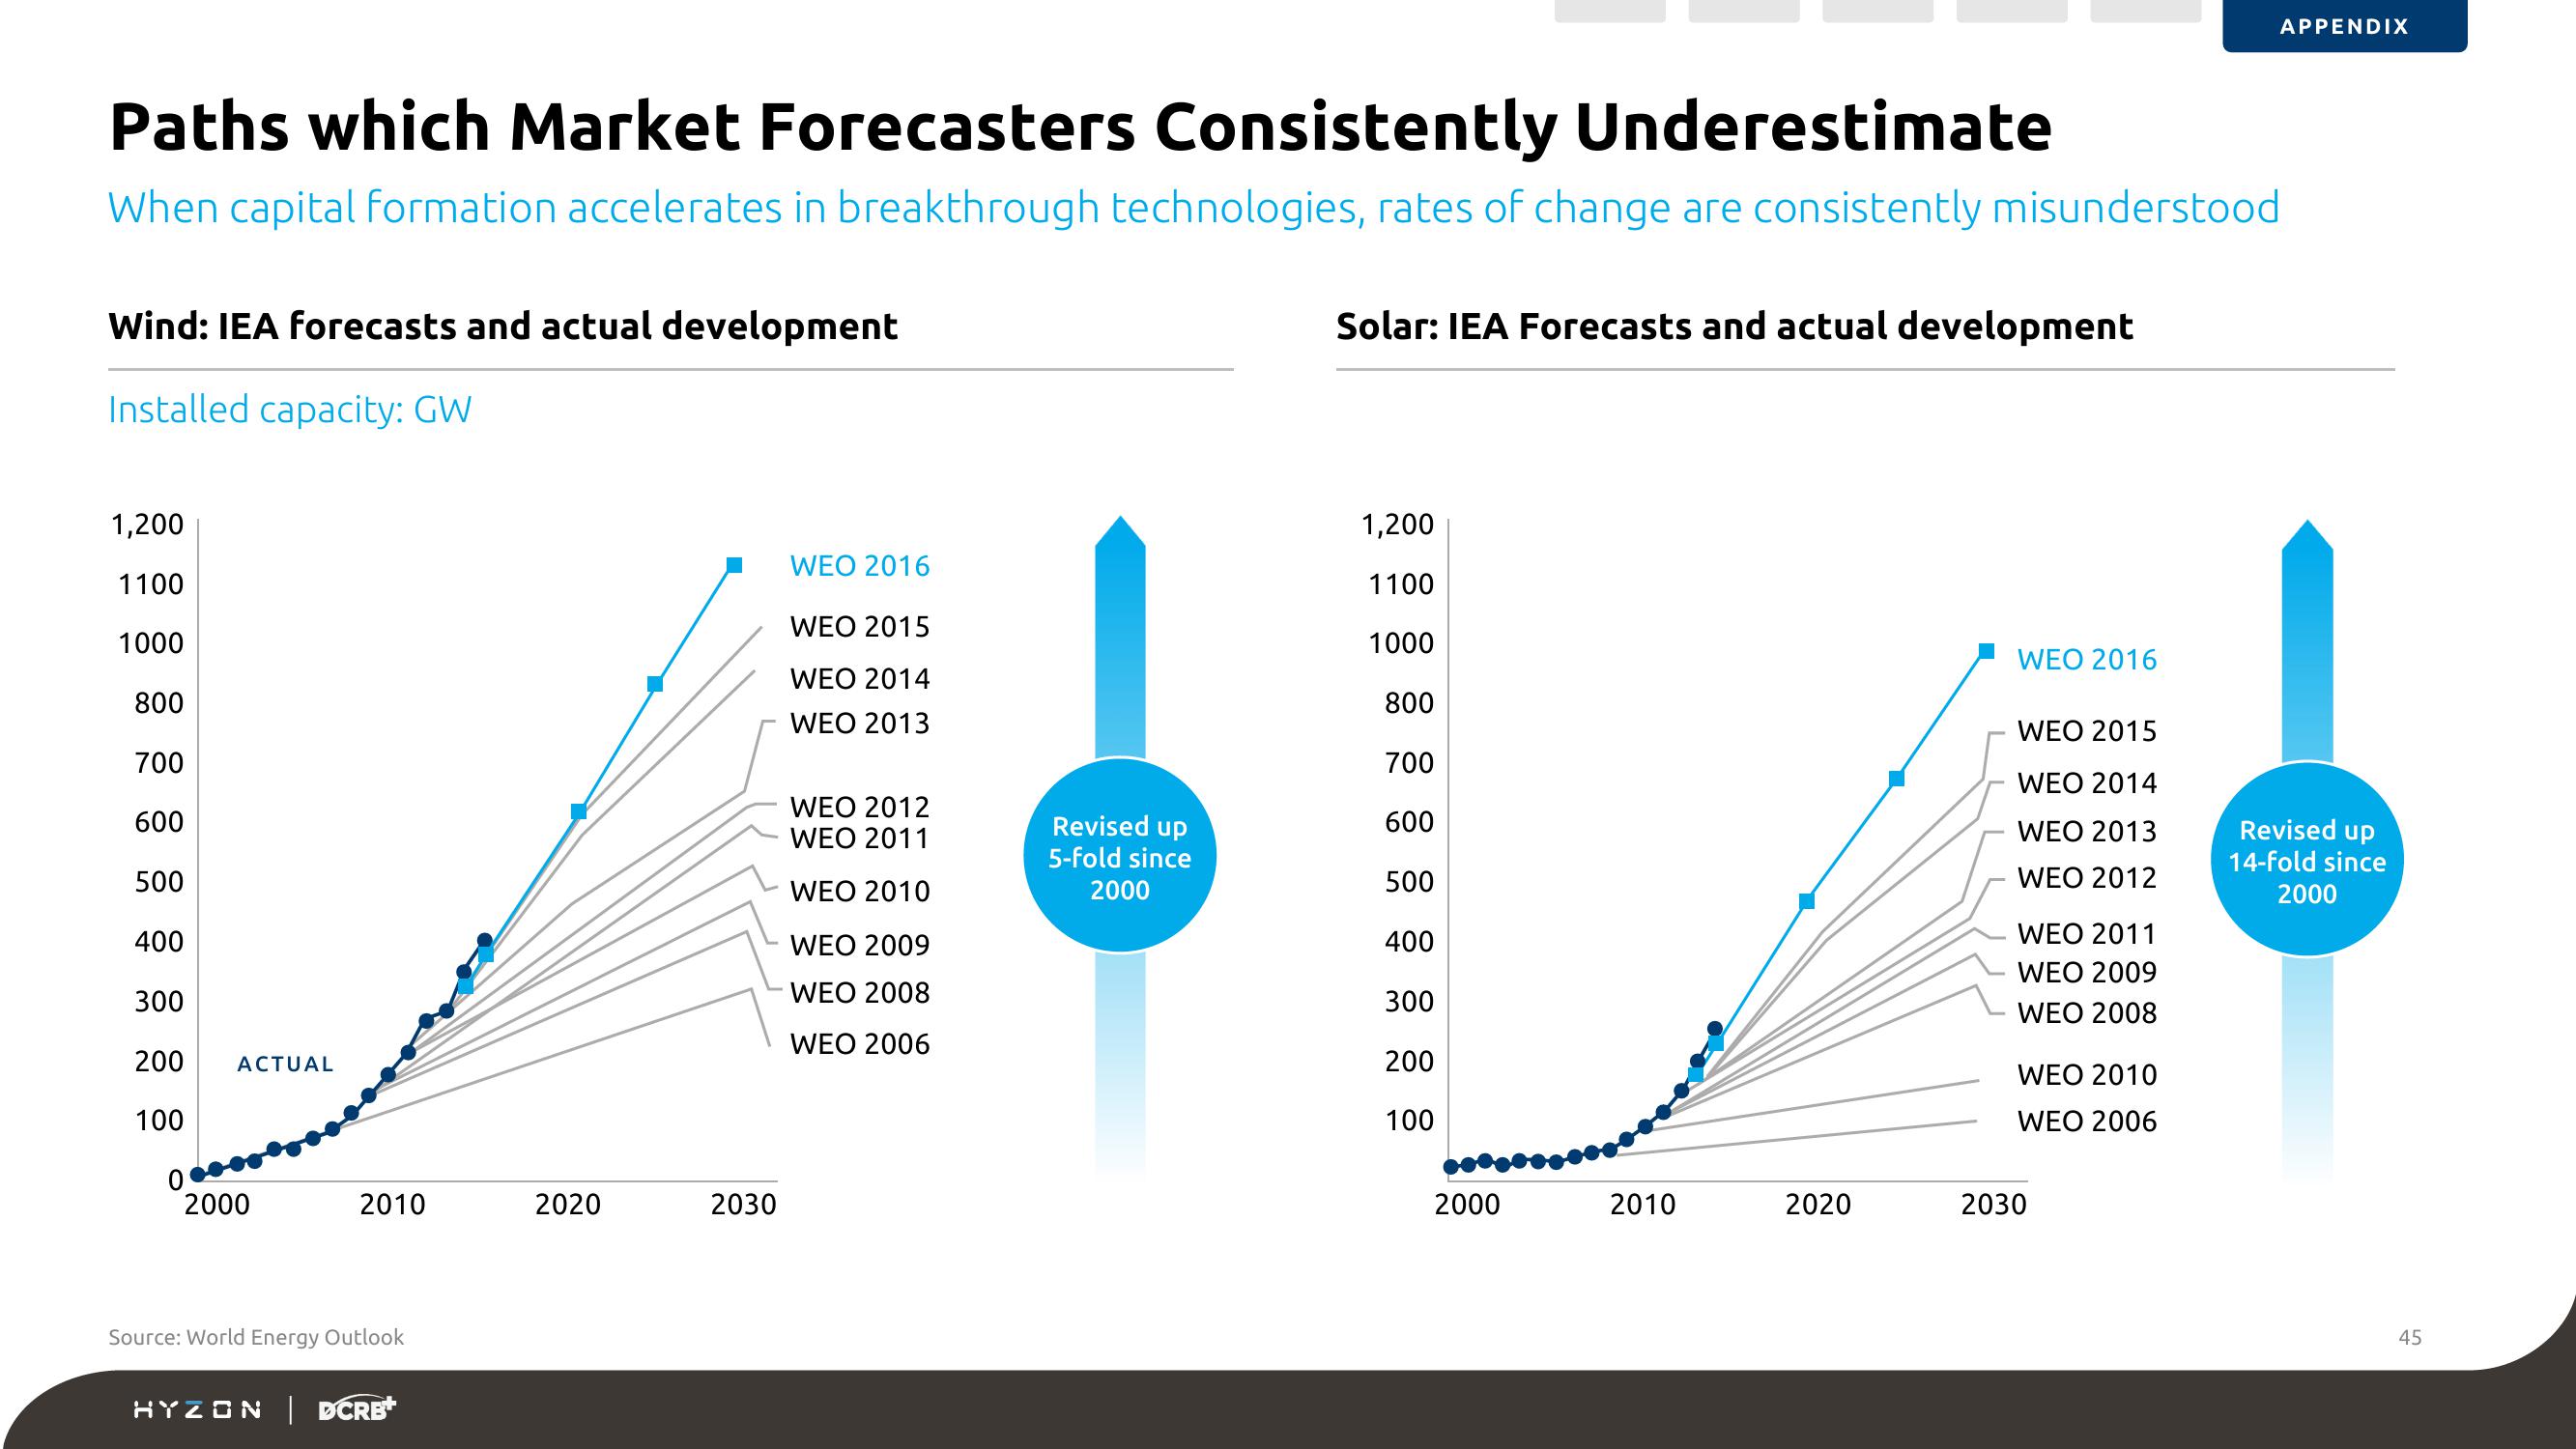
Paths which Market Forecasters Consistently Underestimate When capital formation accelerates in breakthrough technologies, rates of change are consistently misunderstood Wind: IEA forecasts and actual development Installed capacity: GW 1,200 1100 1000 800 700 600 500 400 300 200 100 ACTUAL 2000 2010 Source: World Energy Outlook HYZON | DCRB+ 2020 2030 WEO 2016 WEO 2015 WEO 2014 WEO 2013 WEO 2012 WEO 2011 WEO 2010 WEO 2009 WEO 2008 WEO 2006 Revised up 5-fold since 2000 Solar: IEA Forecasts and actual development 1,200 1100 1000 800 700 600 500 400 300 200 100 2000 2010 2020 WEO 2016 WEO 2015 WEO 2014 WEO 2013 WEO 2012 WEO 2011 WEO 2009 WEO 2008 WEO 2010 WEO 2006 2030 APPENDIX Revised up 14-fold since 2000 45
View entire presentation