GMS Investor Conference Presentation Deck
Attractive Capital Structure Supports Strategic Priorities
Cash From Operations and Free Cash Flow¹
Significant improvement in cash flow as the supply chain
improved
●
●
●
●
Generated Cash from Operating Activities of $134.1
million, compared to $57.2 million in Q3 FY22
●
Generated Free Cash Flow¹ of $122.5 million, compared
to $40.2 million in Q3 FY22
Substantial liquidity, with $186.7 million of cash on hand
and an additional $574.4 million available under our
revolving credit facilities as of 1/31/2023
Fiscal year 2023 Free Cash Flow¹ is expected to exceed
our "Through the Cycle" expectation of 40% - 50% of
Adjusted EBITDA¹
Increased Share Repurchase Activity
Repurchased approximately 656 thousand shares for
$33.2 million during Q3 FY23
As of the end of Q3 FY23, $128 million of repurchase
authorization remained
GMS
GYPSUM MANAGEMENT & SUPPLY, INC.
$ in millions
X
1/31/2022
FY23
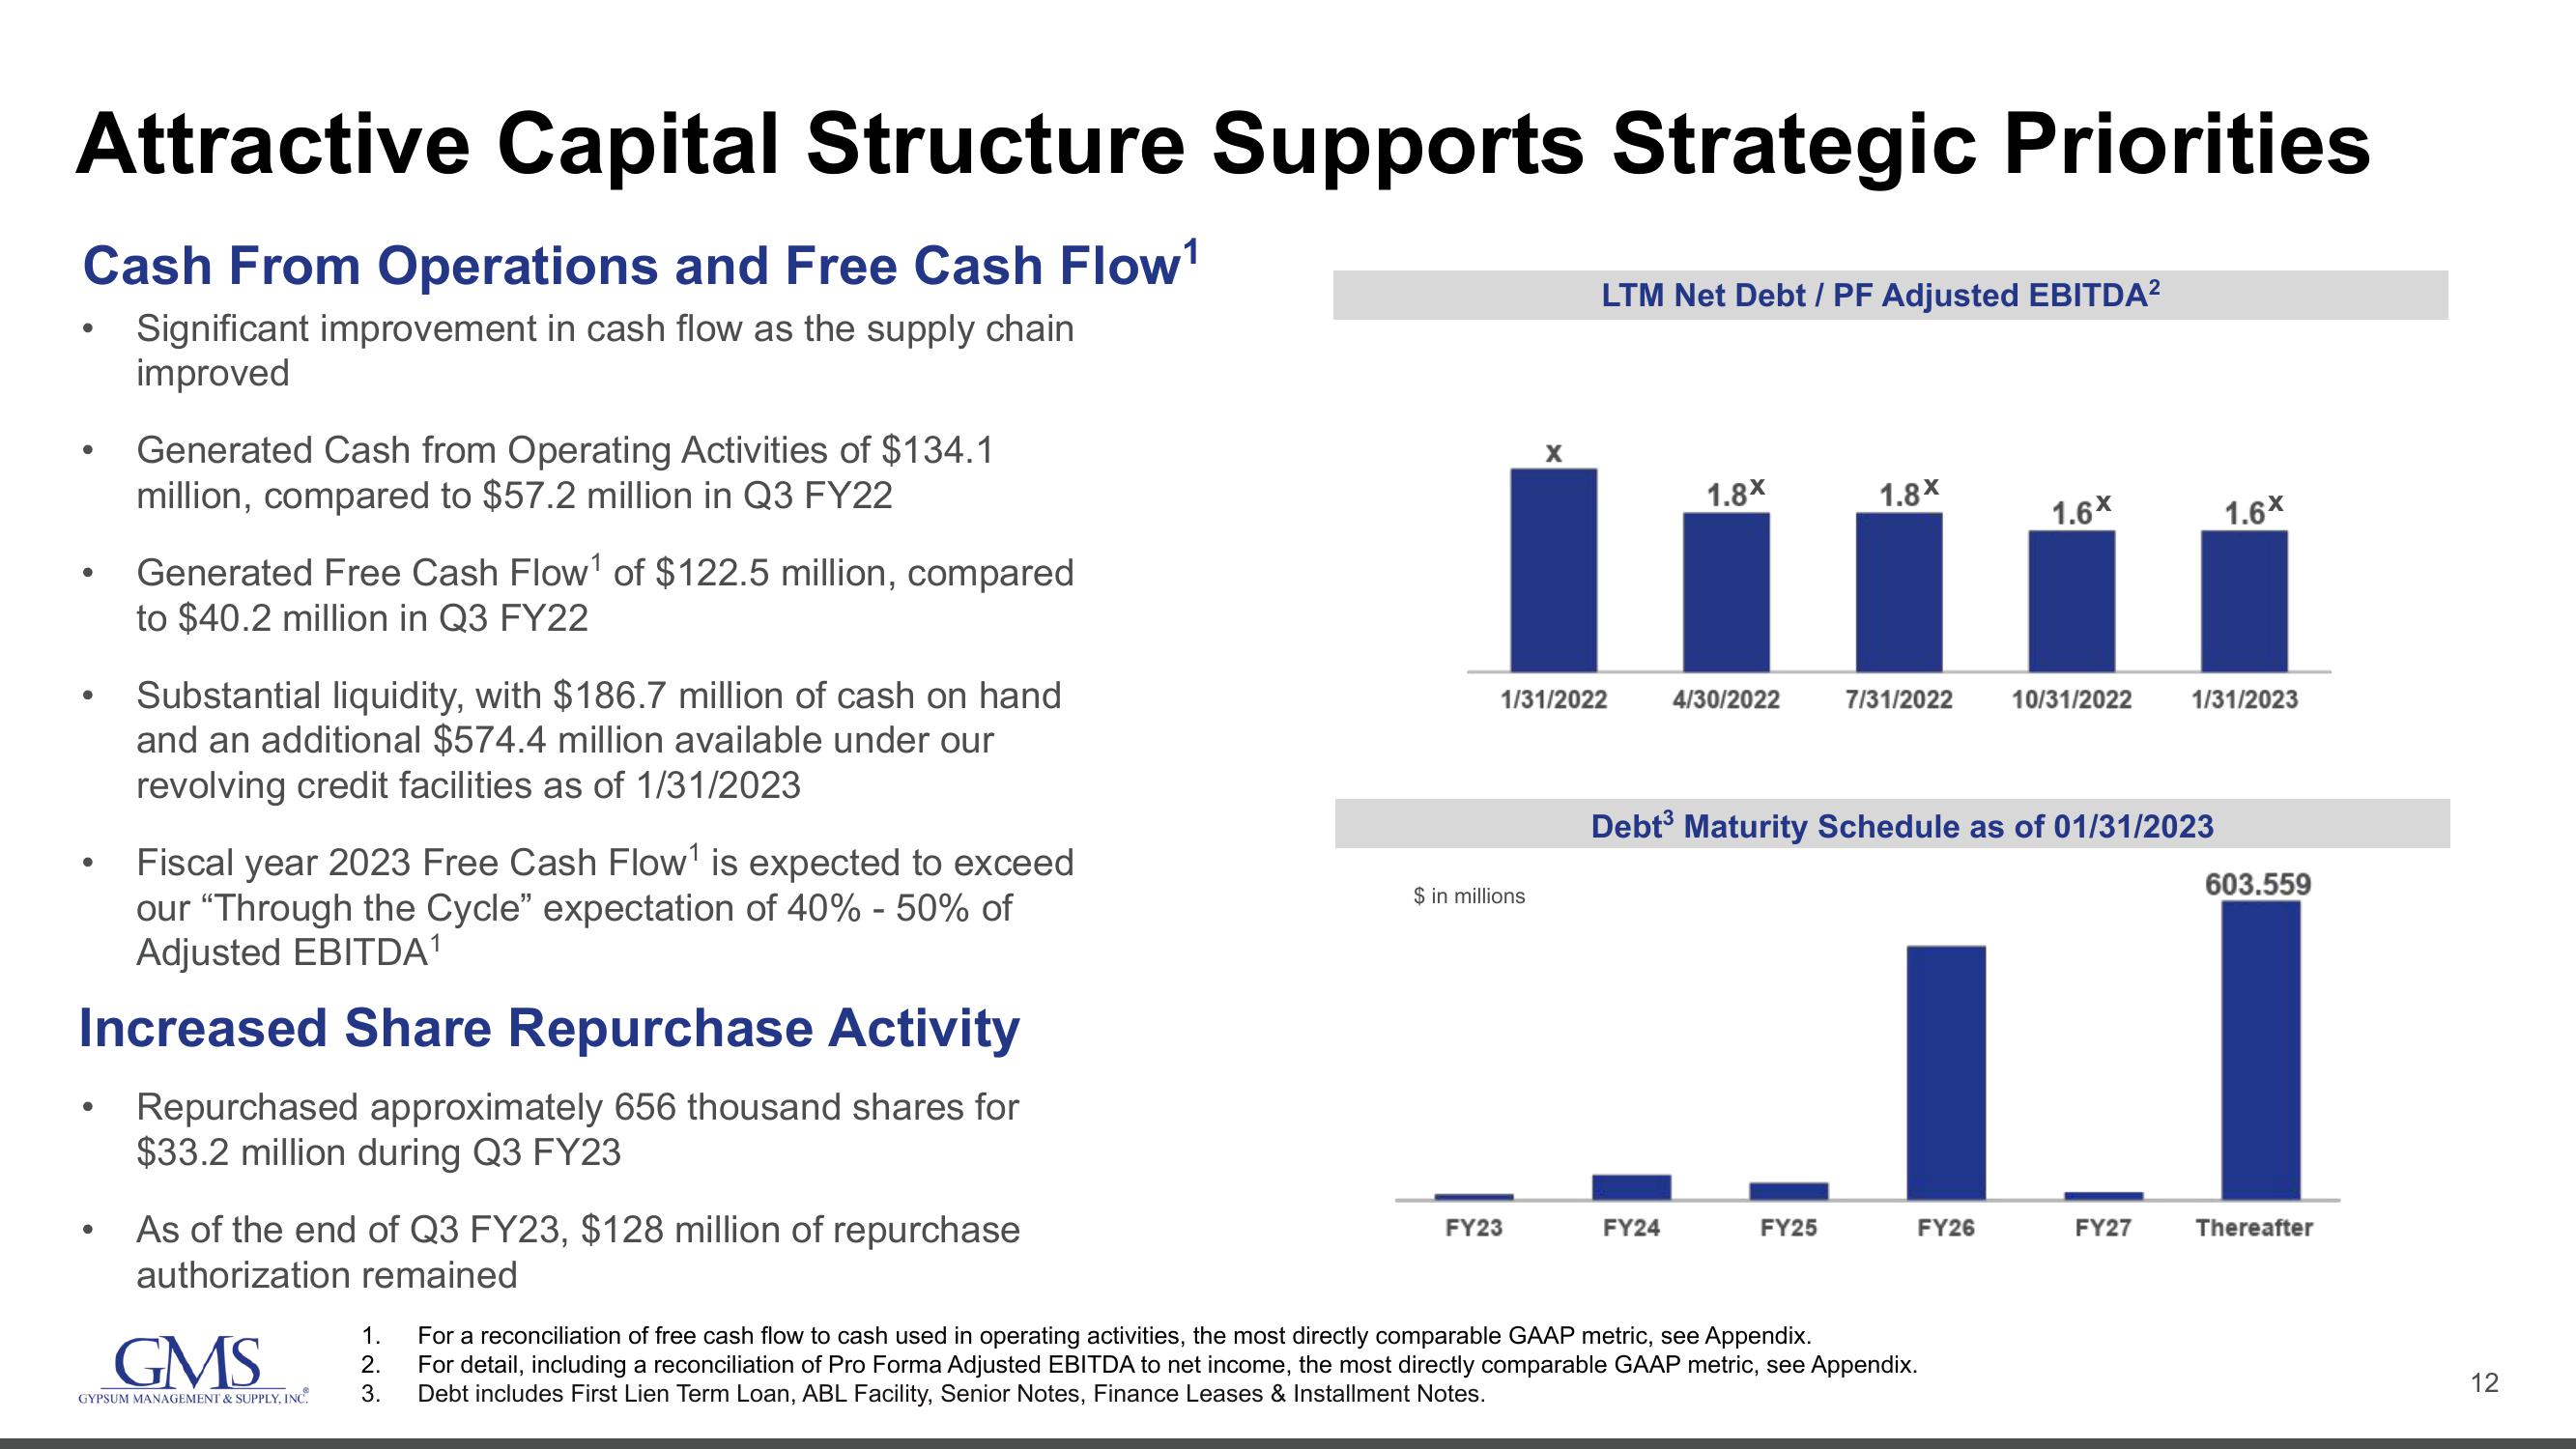
LTM Net Debt / PF Adjusted EBITDA²
1.8X
FY24
4/30/2022
1.8X
FY25
7/31/2022
Debt³ Maturity Schedule as of 01/31/2023
FY26
1.6X
1. For a reconciliation of free cash flow to cash used in operating activities, the most directly comparable GAAP metric, see Appendix.
2. For detail, including a reconciliation of Pro Forma Adjusted EBITDA to net income, the most directly comparable GAAP metric, see Appendix.
Debt includes First Lien Term Loan, ABL Facility, Senior Notes, Finance Leases & Installment Notes.
3.
10/31/2022
FY27
1.6X
1/31/2023
603.559
Thereafter
12View entire presentation