Snap Inc Results Presentation Deck
Adjusted
Gross
Margin¹
Adjusted Cost of Revenue¹
ADJUSTED COST OF REVENUE AS A % OF REVENUE
53%
Q1'21
47%
45%
Q2'21
55%
40%
Q3'21
60%
- 5 PPT
34%
Q4'21
66%
39%
Q1'22
61%
39%
Q2'22
61%
Total Non-GAAP
Exclusions¹
COST OF REVENUE COMPOSITION²
(in millions, unaudited)
Total GAAP Cost of
Revenue
Infrastructure Costs
Advertising Partner & Other Costs
$404
$179
$51
$174
Q1'21
$8
$437
$182
$74
$182
Q2'21
$8
$429
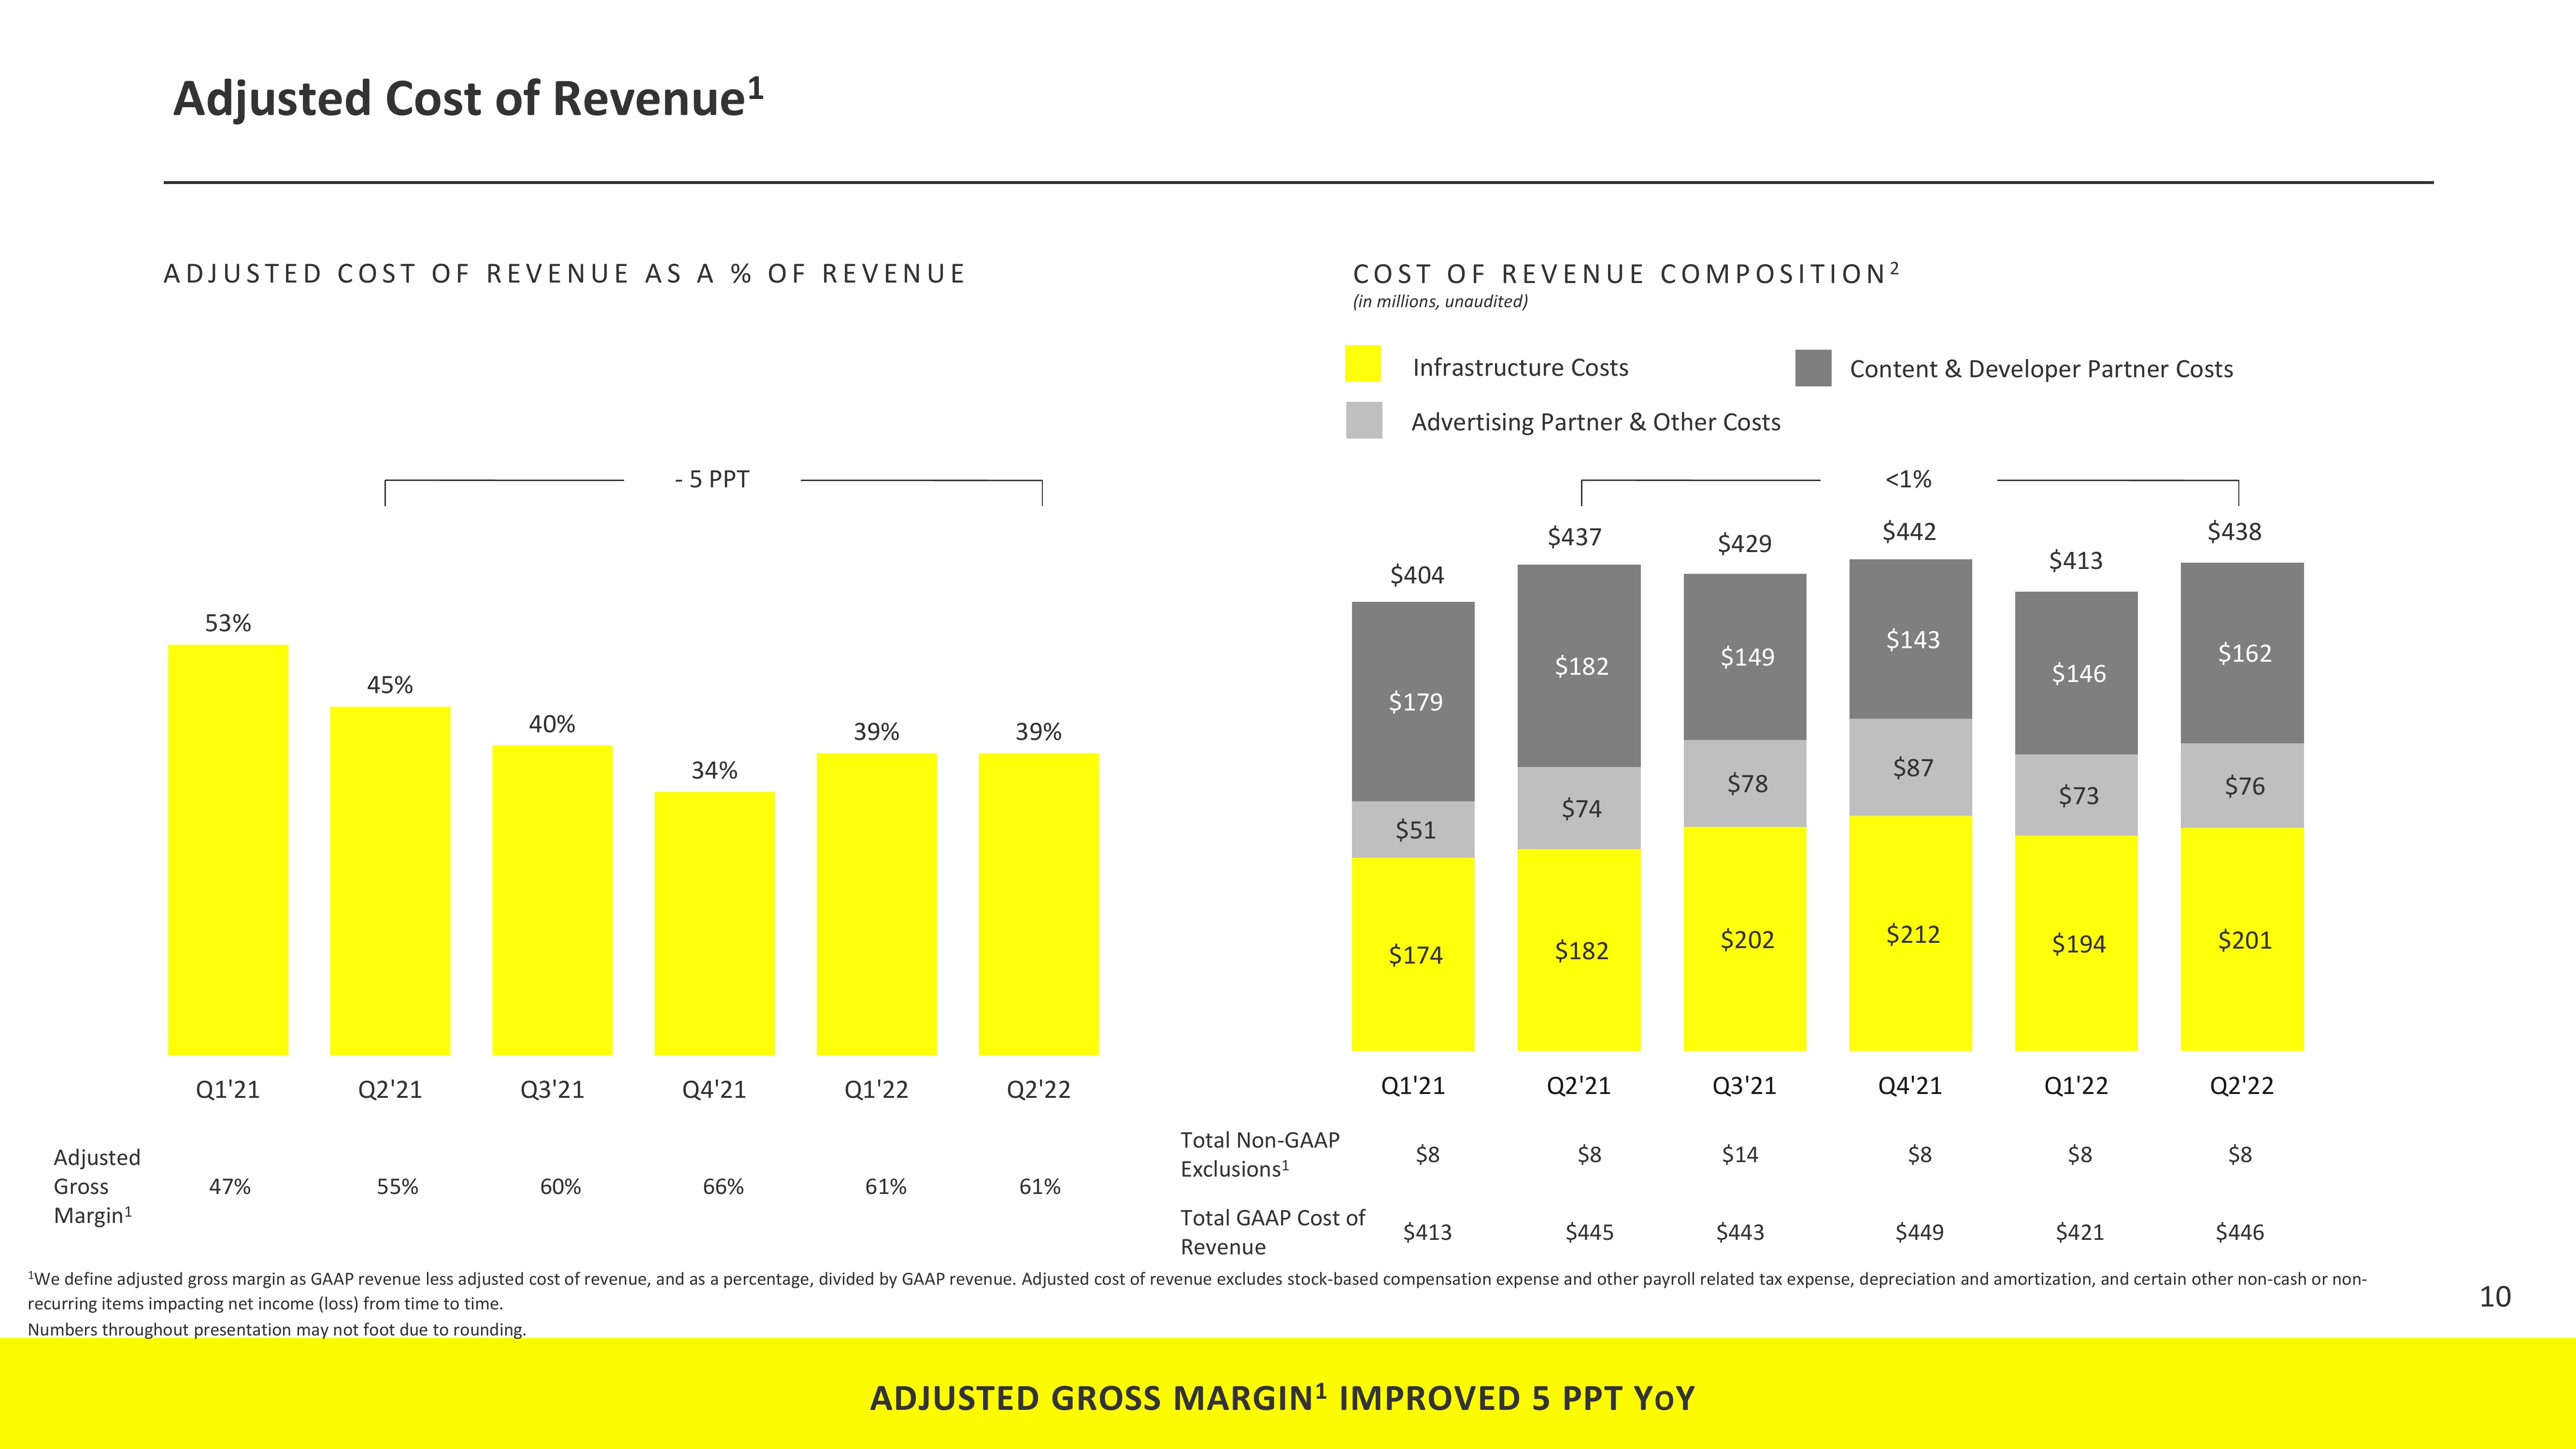
ADJUSTED GROSS MARGIN¹ IMPROVED 5 PPT YOY
$149
$78
$202
Q3'21
$14
Content & Developer Partner Costs
<1%
$442
$143
$87
$212
Q4'21
$8
$413
$146
$73
$194
Q1'22
$8
$438
$421
$162
$76
$201
Q2'22
$413
$445
$443
$449
$446
¹We define adjusted gross margin as GAAP revenue less adjusted cost of revenue, and as a percentage, divided by GAAP revenue. Adjusted cost of revenue excludes stock-based compensation expense and other payroll related tax expense, depreciation and amortization, and certain other non-cash or non-
recurring items impacting net income (loss) from time to time.
Numbers throughout presentation may not foot due to rounding.
$8
10View entire presentation