Credit Suisse Investment Banking Pitch Book
CREDIT SUISSE DOES NOT PROVIDE ANY TAX ADVICE | MATERIALS ARE PRELIMINARY AND SUBJECT TO FURTHER CHANGE AND DEVELOPMENTS (WHICH MAY BE MATERIAL)
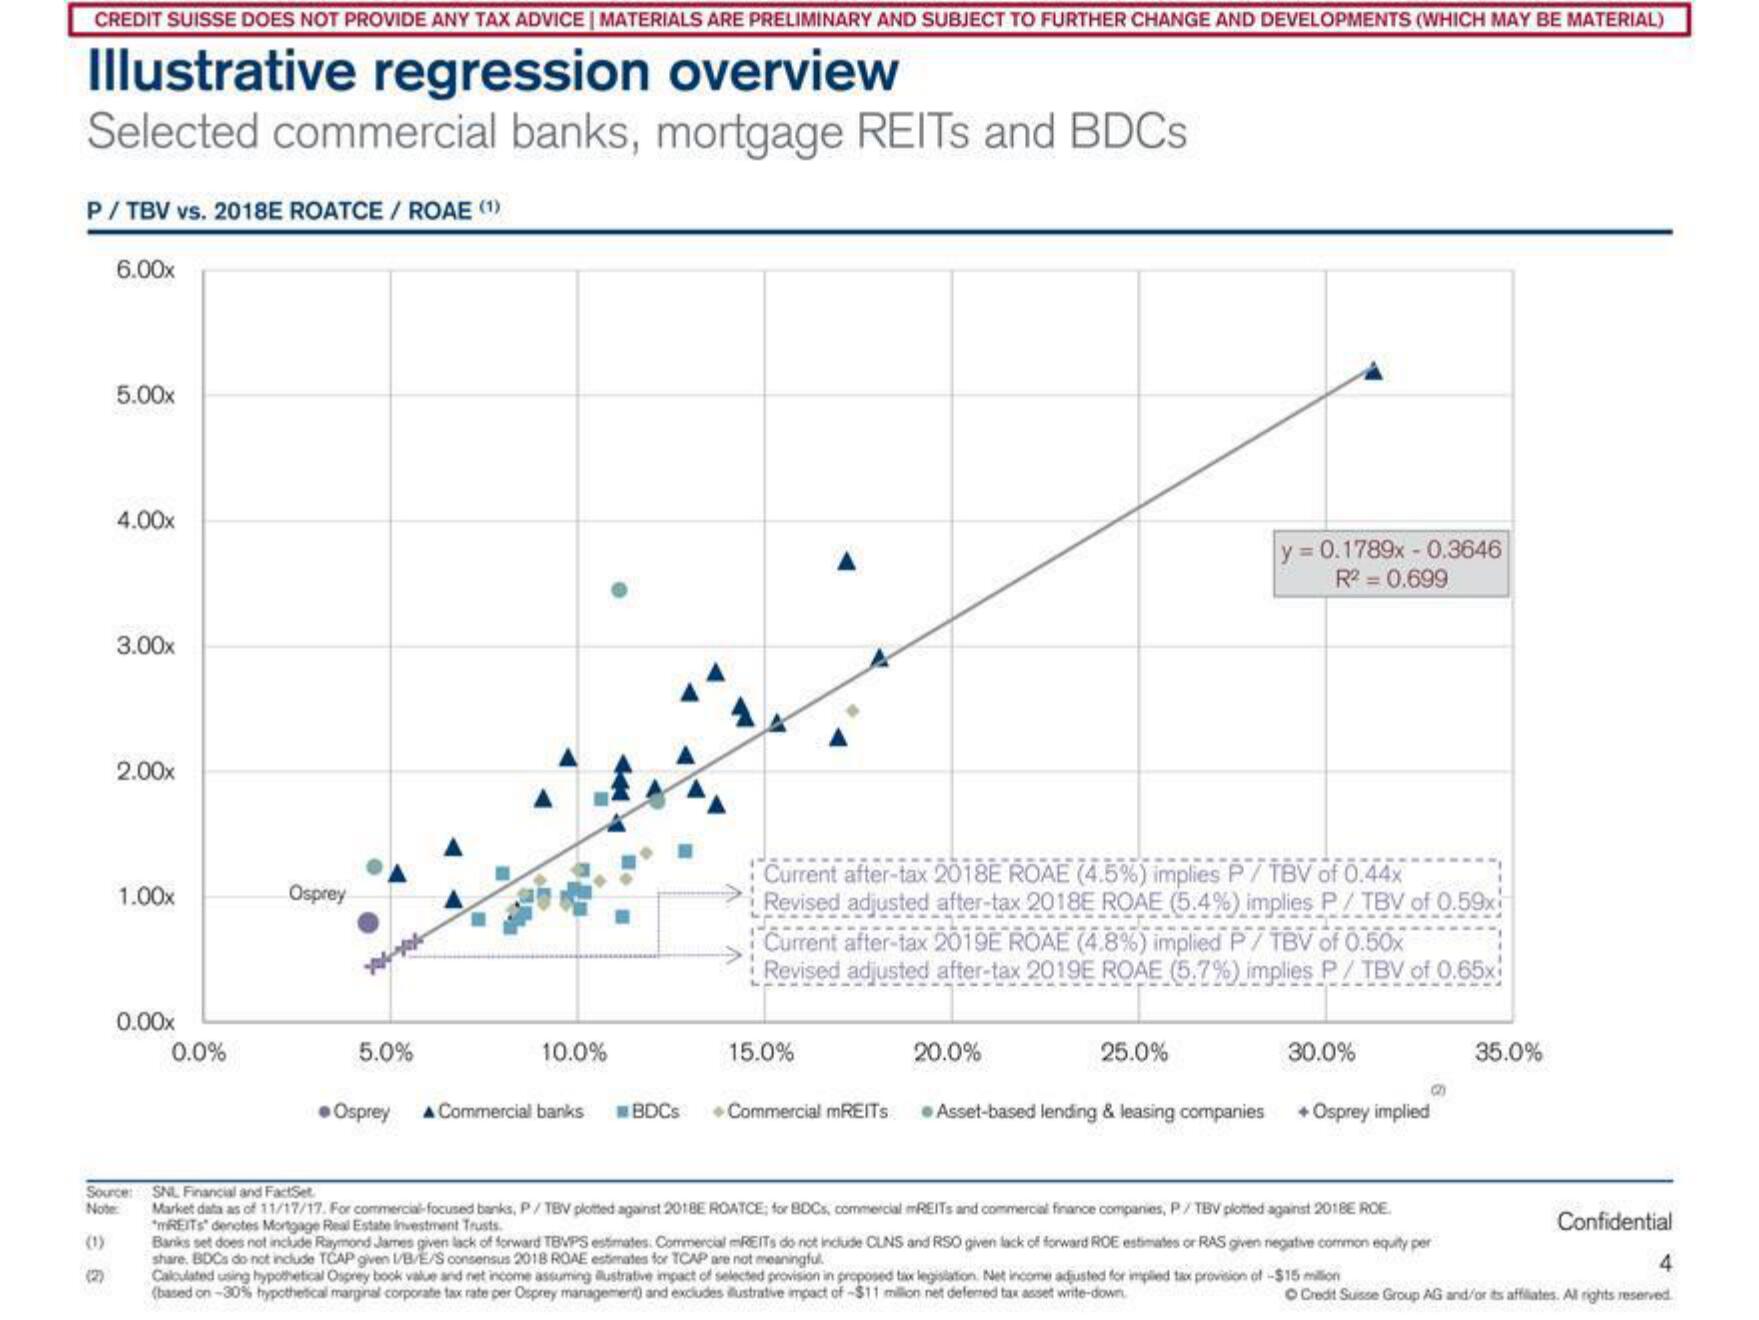
Illustrative regression overview
Selected commercial banks, mortgage REITS and BDCs
P/TBV vs. 2018E ROATCE / ROAE (1)
6.00x
5.00x
33
4.00x
3.00x
2.00x
1.00x
0.00x
0.0%
Osprey
5.0%
●Osprey
10.0%
Commercial banks
BDCs
Currer after 2018E ROAE (4.5%) implies P/TBV of 0.44x
Revised adjusted after-tax 2018E ROAE (5.4%) implies P/TBV of 0.59x
Current after-tax 2019E ROAE (4.8%) implied P/TBV of 0.50x
Revised adjusted after-tax 2019E ROAE (5.7%) implies P/TBV of 0.65x
15.0%
Commercial mREITS
20.0%
y = 0.1789x -0.3646
R² = 0.699
25.0%
30.0%
3
Asset-based lending & leasing companies +Osprey implied
Source: SNL Financial and FactSet
Note:
Market data as of 11/17/17. For commercial focused banks, P/TBV plotted against 2018E ROATCE; for BDCs, commercial
"REITS denotes Mortgage Real Estate Investment Trusts.
REITs and commercial finance companies, P/TBV plotted against 2018E ROE.
Banks set does not include Raymond James given lack of forward TBVPS estimates Commercial REITs do not include CLNS and RSO given lack of forward ROE estimates or RAS given negative common equity per
share. BDCs do not include TCAP given I/B/E/S consensus 2018 ROAE estimates for TCAP are not meaningful
Calculated using hypothetical Osprey book value and net income assuming alustrative impact of selected provision in proposed tax legislation. Net income adjusted for implied tax provision of -$15 million
(based on-30% hypothetical marginal corporate tax rate per Osprey management) and excludes illustrative impact of -$11 million net deferred tax asset write-down
35.0%
Confidential
4
O Credit Suisse Group AG and/or its affiliates. All rights reserved.View entire presentation