Rightmove Results Presentation Deck
4
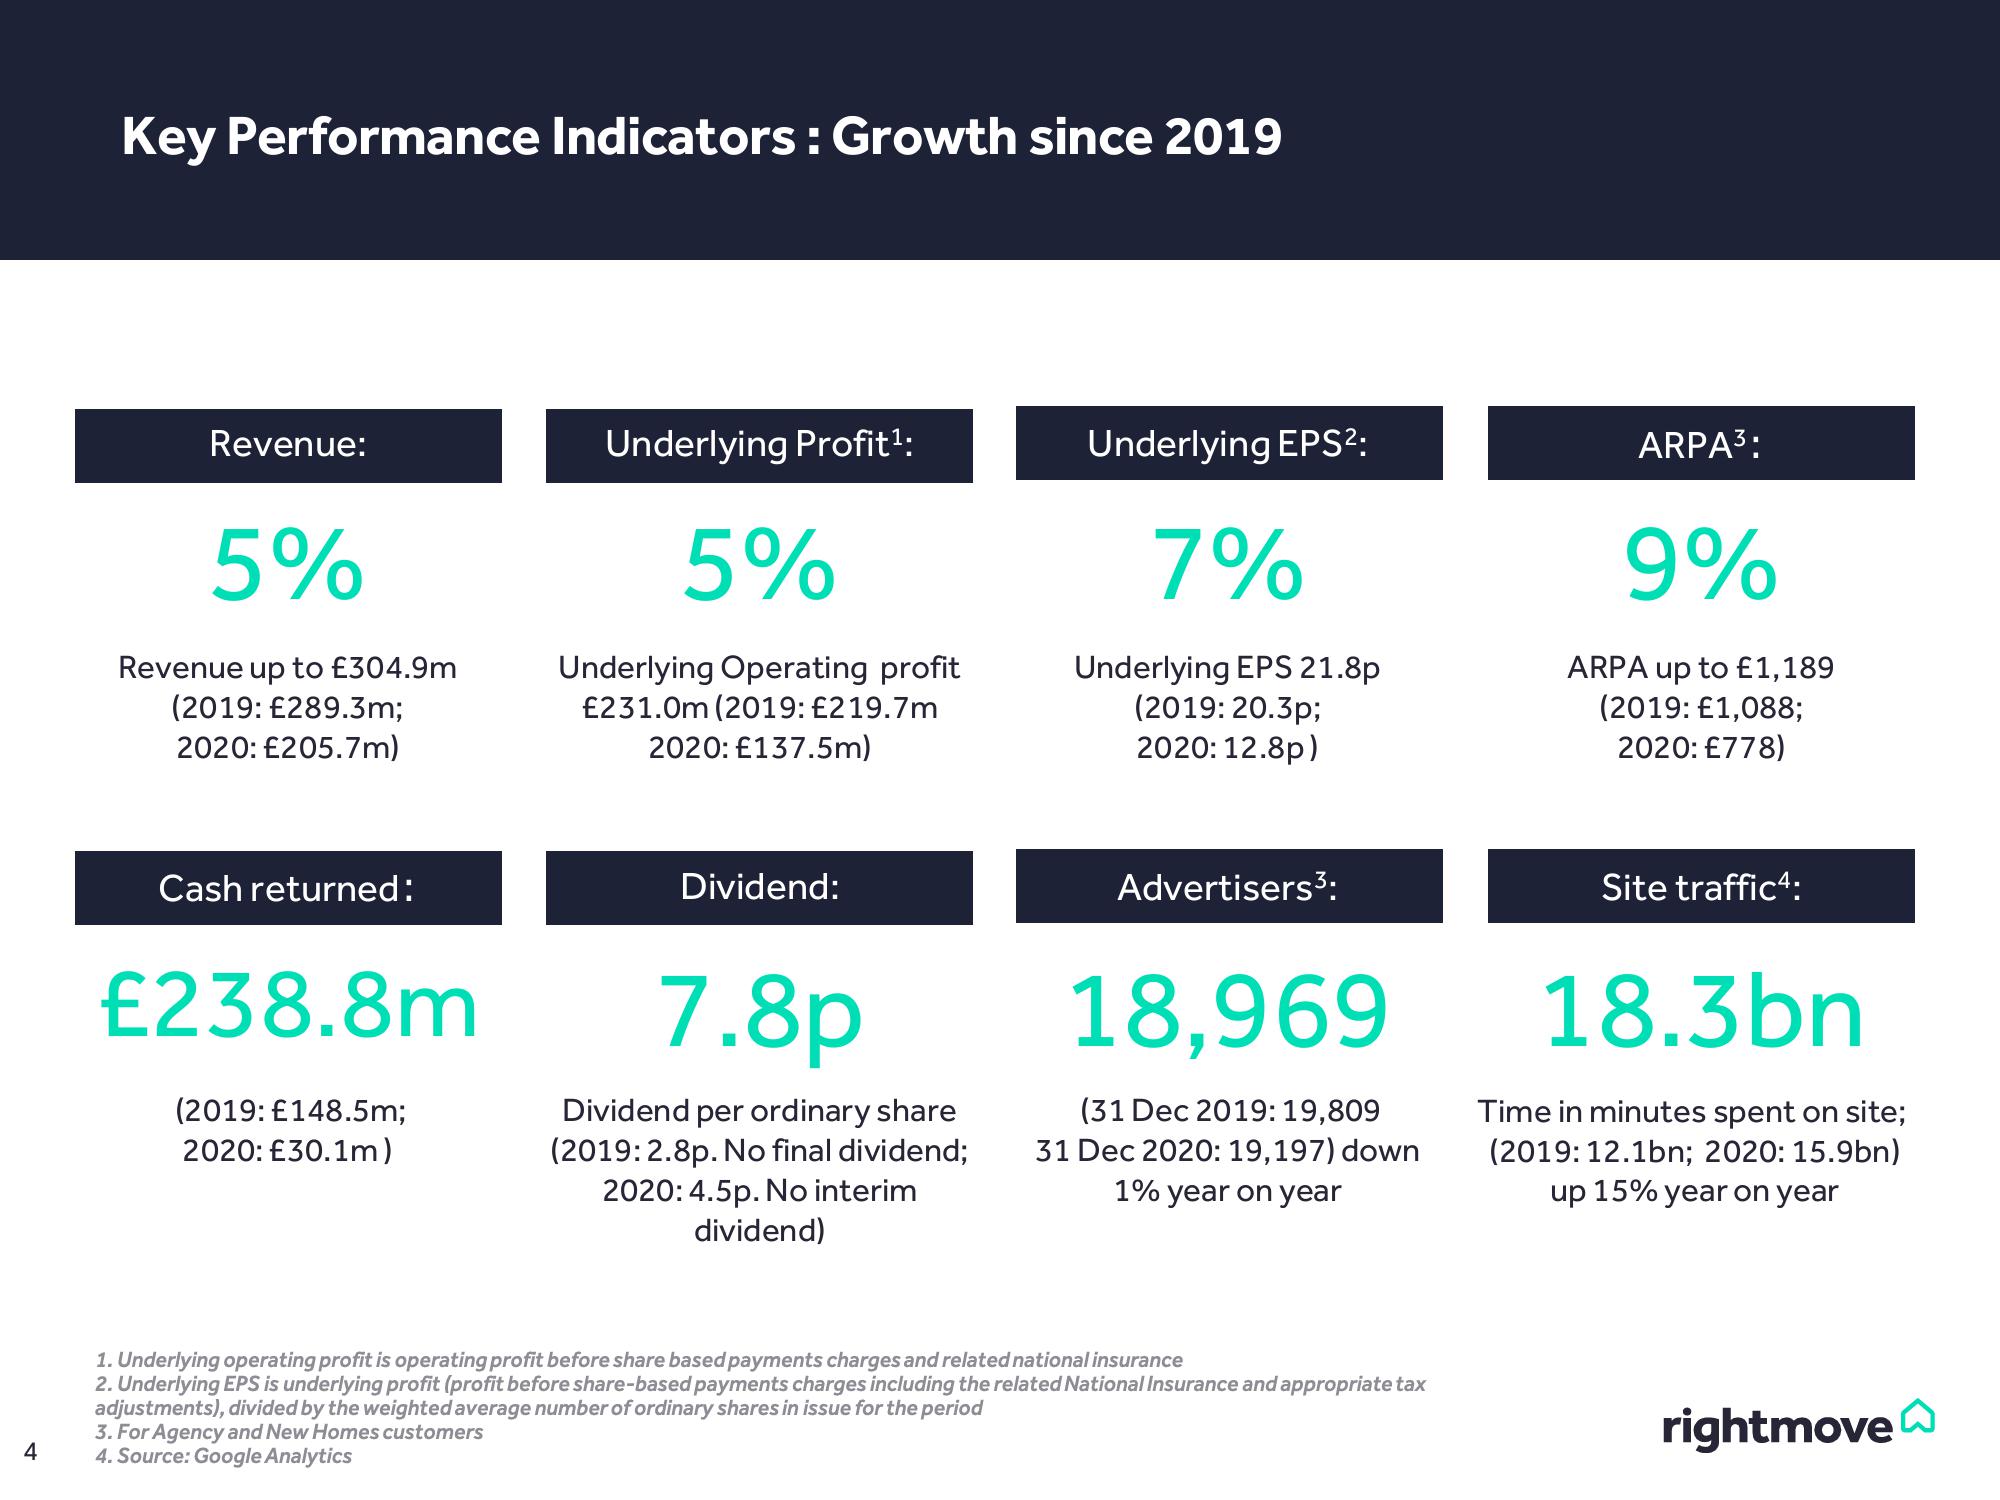
Key Performance Indicators: Growth since 2019
Revenue:
5%
Revenue up to £304.9m
(2019: £289.3m;
2020: £205.7m)
Cash returned:
£238.8m
(2019: £148.5m;
2020: £30.1m)
Underlying Profit¹:
5%
Underlying Operating profit
£231.0m (2019: £219.7m
2020: £137.5m)
Dividend:
7.8p
Dividend per ordinary share
(2019: 2.8p. No final dividend;
2020: 4.5p. No interim
dividend)
Underlying EPS²:
7%
Underlying EPS 21.8p
(2019: 20.3p;
2020: 12.8p)
Advertisers ³:
18,969
(31 Dec 2019: 19,809
31 Dec 2020: 19,197) down
1% year on year
1. Underlying operating profit is operating profit before share based payments charges and related national insurance
2. Underlying EPS is underlying profit (profit before share-based payments charges including the related National Insurance and appropriate tax
adjustments), divided by the weighted average number of ordinary shares in issue for the period
3. For Agency and New Homes customers
4. Source: Google Analytics
ARPA³:
9%
ARPA up to £1,189
(2019: £1,088;
2020: £778)
Site traffic4:
18.3bn
Time in minutes spent on site;
(2019: 12.1bn; 2020: 15.9bn)
up 15% year on year
rightmoveView entire presentation