J.P.Morgan Investment Banking Pitch Book
VALUATION SUMMARY
Leveraged buyout analysis
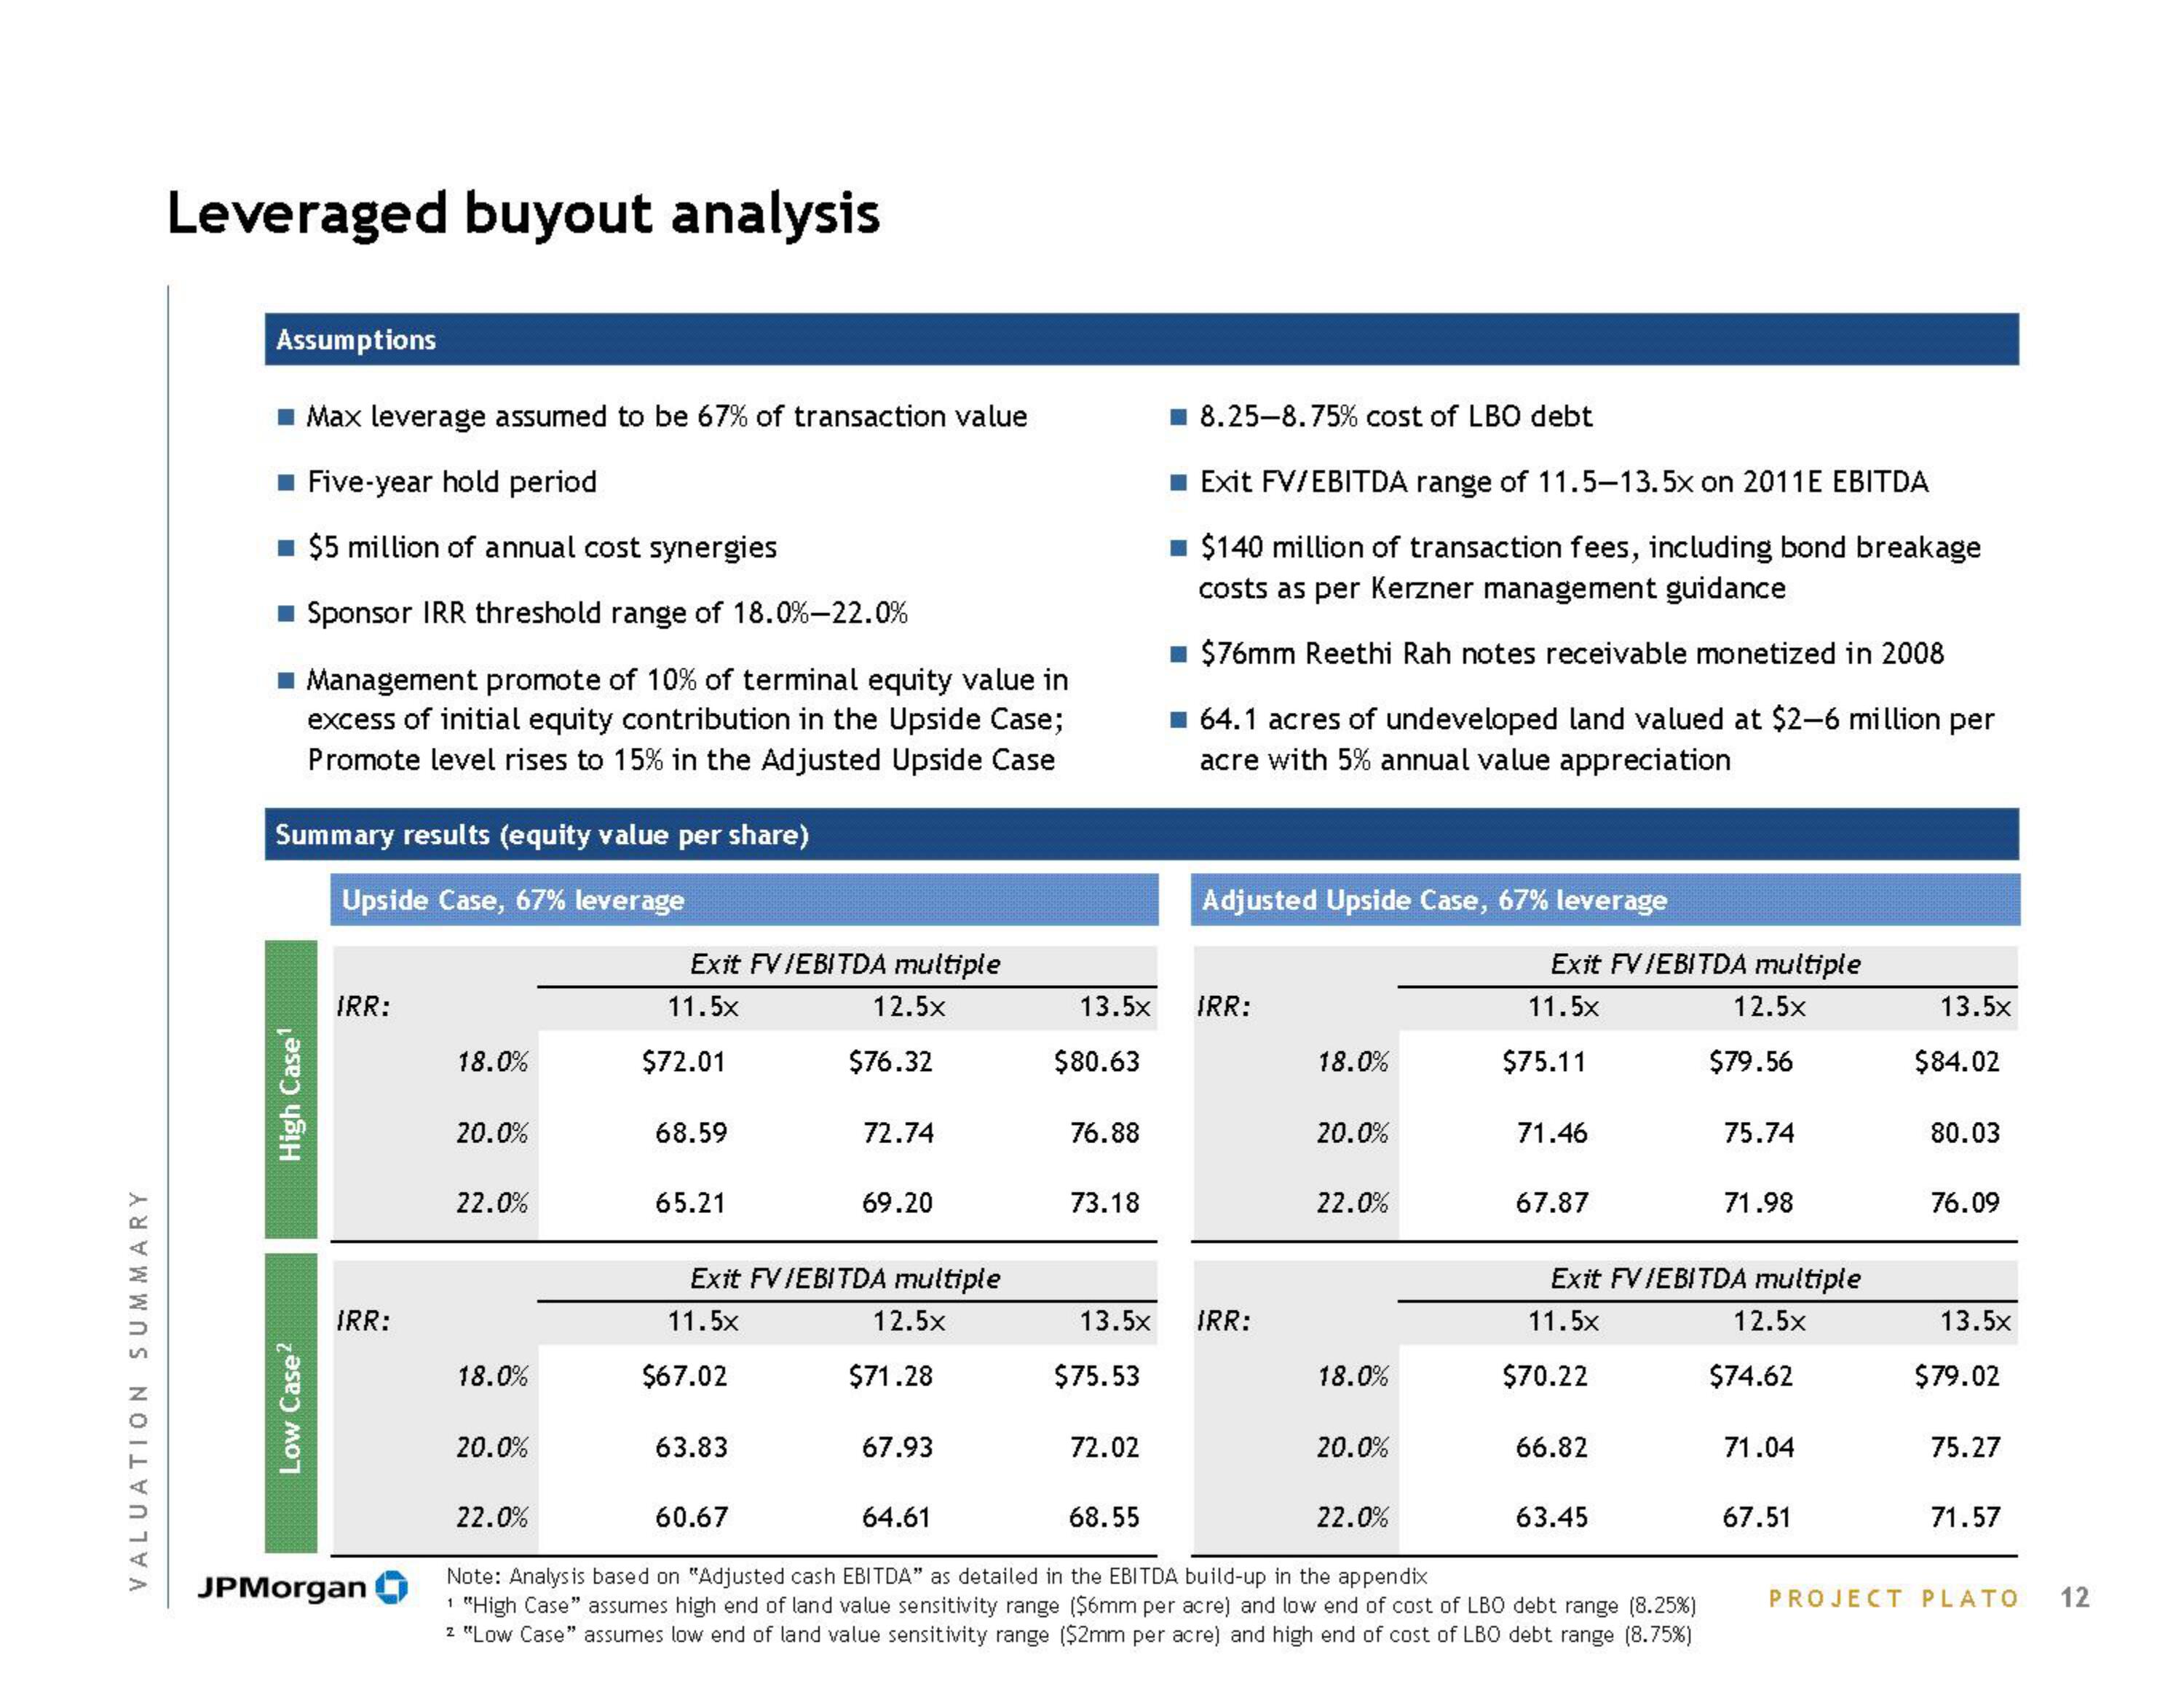
Assumptions
Max leverage assumed to be 67% of transaction value
■ Five-year hold period
■ $5 million of annual cost synergies
■ Sponsor IRR threshold range of 18.0%-22.0%
■Management promote of 10% of terminal equity value in
excess of initial equity contribution in the Upside Case;
Promote level rises to 15% in the Adjusted Upside Case
Summary results (equity value per share)
Upside Case, 67% leverage
High Case¹
Low Case²
IRR:
IRR:
JPMorgan
18.0%
20.0%
22.0%
18.0%
20.0%
Exit FV/EBITDA multiple
11.5×
12.5×
22.0%
$72.01
68.59
65.21
$67.02
63.83
$76.32
Exit FV/EBITDA multiple
11.5×
12.5×
72.74
60.67
69.20
$71.28
67.93
13.5×
$80.63
76.88
73.18
$75.53
72.02
8.25-8.75% cost of LBO debt
■Exit FV/EBITDA range of 11.5-13.5x on 2011 E EBITDA
■ $140 million of transaction fees, including bond breakage
costs as per Kerzner management guidance
■ $76mm Reethi Rah notes receivable monetized in 2008
☐ 64.1 acres of undeveloped land valued at $2-6 million per
acre with 5% annual value appreciation
13.5× IRR:
Adjusted Upside Case, 67% leverage
68.55
IRR:
18.0%
20.0%
22.0%
18.0%
20.0%
Exit FV/EBITDA multiple
11.5×
12.5×
22.0%
$75.11
71.46
67.87
64.61
Note: Analysis based on "Adjusted cash EBITDA" as detailed in the EBITDA build-up in the appendix
1 "High Case" assumes high end of land value sensitivity range ($6mm per acre) and low end of cost of LBO debt range (8.25 %)
z "Low Case" assumes low end of land value sensitivity range ($2mm per acre) and high end of cost of LBO debt range (8.75%)
$70.22
66.82
Exit FV/EBITDA multiple
11.5×
12.5×
$79.56
63.45
75.74
71.98
$74.62
71.04
67.51
13.5×
$84.02
80.03
76.09
13.5×
$79.02
75.27
71.57
PROJECT PLATO
12View entire presentation