Commercial Metals Company Investor Presentation Deck
Performing Like an Industry Leader
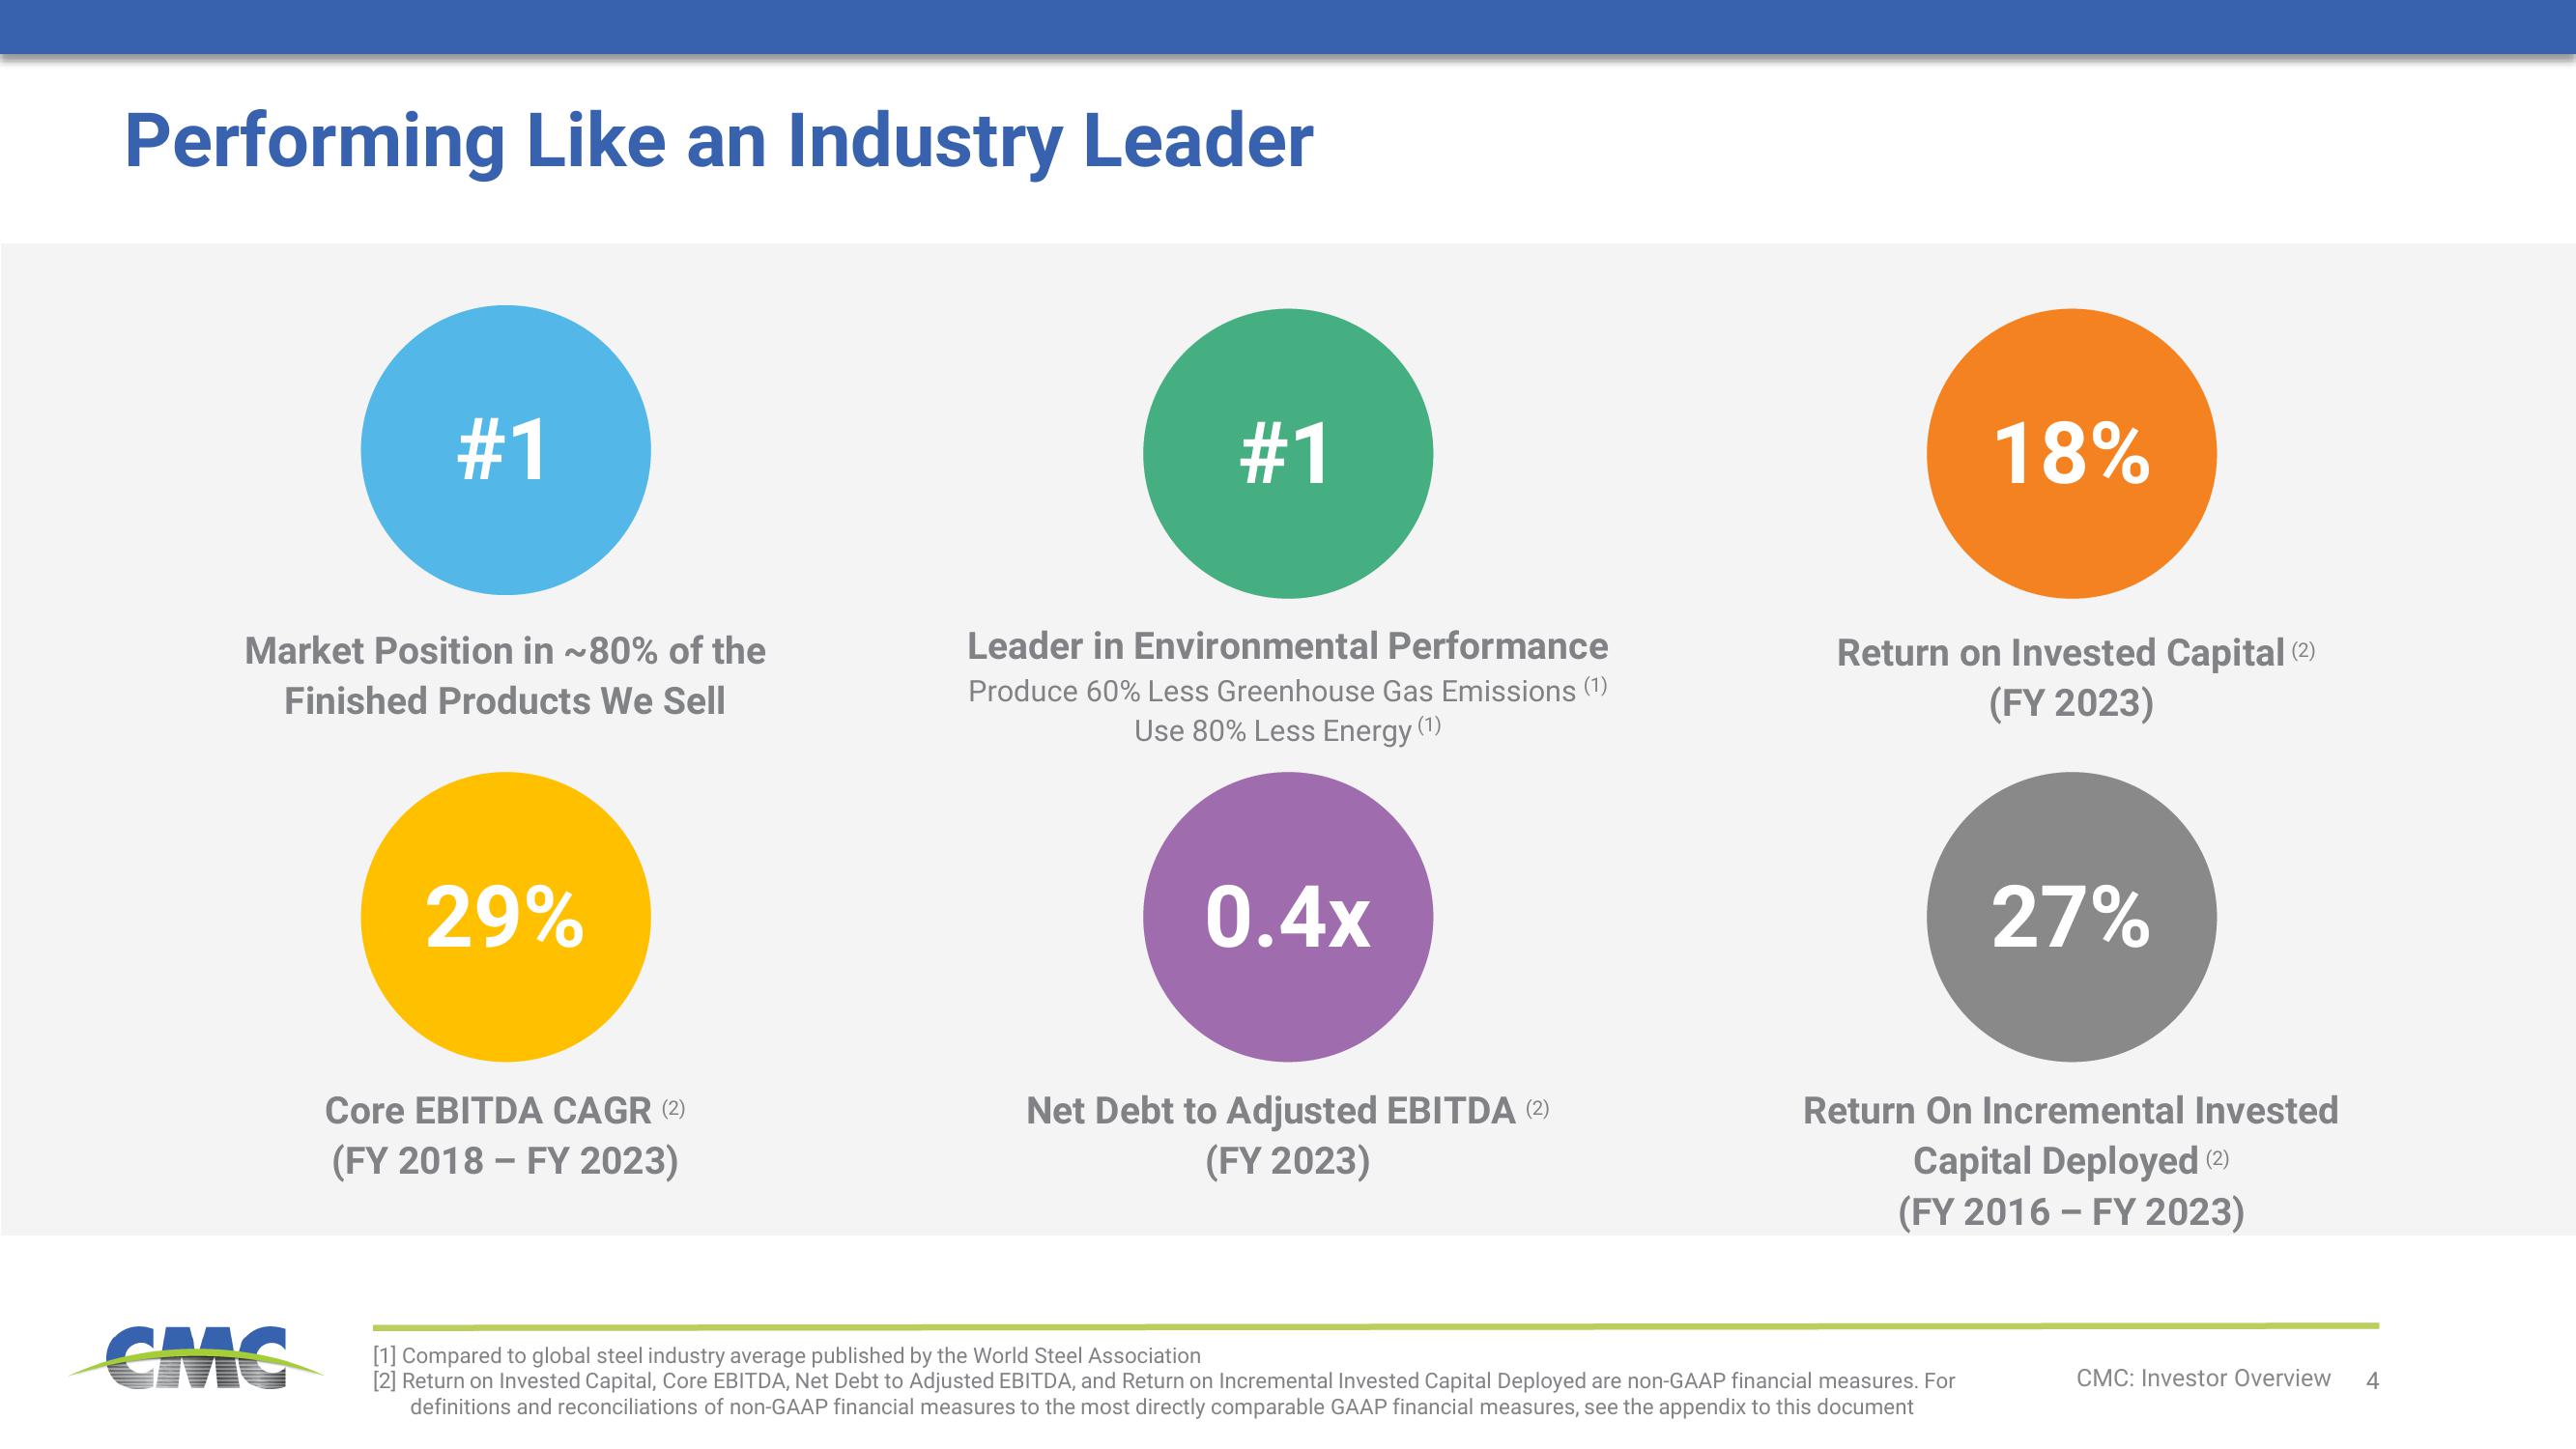
#1
Market Position in ~80% of the
Finished Products We Sell
CMC
29%
Core EBITDA CAGR (2)
(FY 2018 - FY 2023)
#1
Leader in Environmental Performance
Produce 60% Less Greenhouse Gas Emissions (1)
Use 80% Less Energy (1)
0.4x
Net Debt to Adjusted EBITDA (2)
(FY 2023)
18%
Return on Invested Capital (2)
(FY 2023)
[1] Compared to global steel industry average published by the World Steel Association
[2] Return on Invested Capital, Core EBITDA, Net Debt to Adjusted EBITDA, and Return on Incremental Invested Capital Deployed are non-GAAP financial measures. For
definitions and reconciliations of non-GAAP financial measures to the most directly comparable GAAP financial measures, see the appendix to this document
27%
Return On Incremental Invested
Capital Deployed (2)
(FY 2016 - FY 2023)
CMC: Investor Overview
4View entire presentation