Avantor Results Presentation Deck
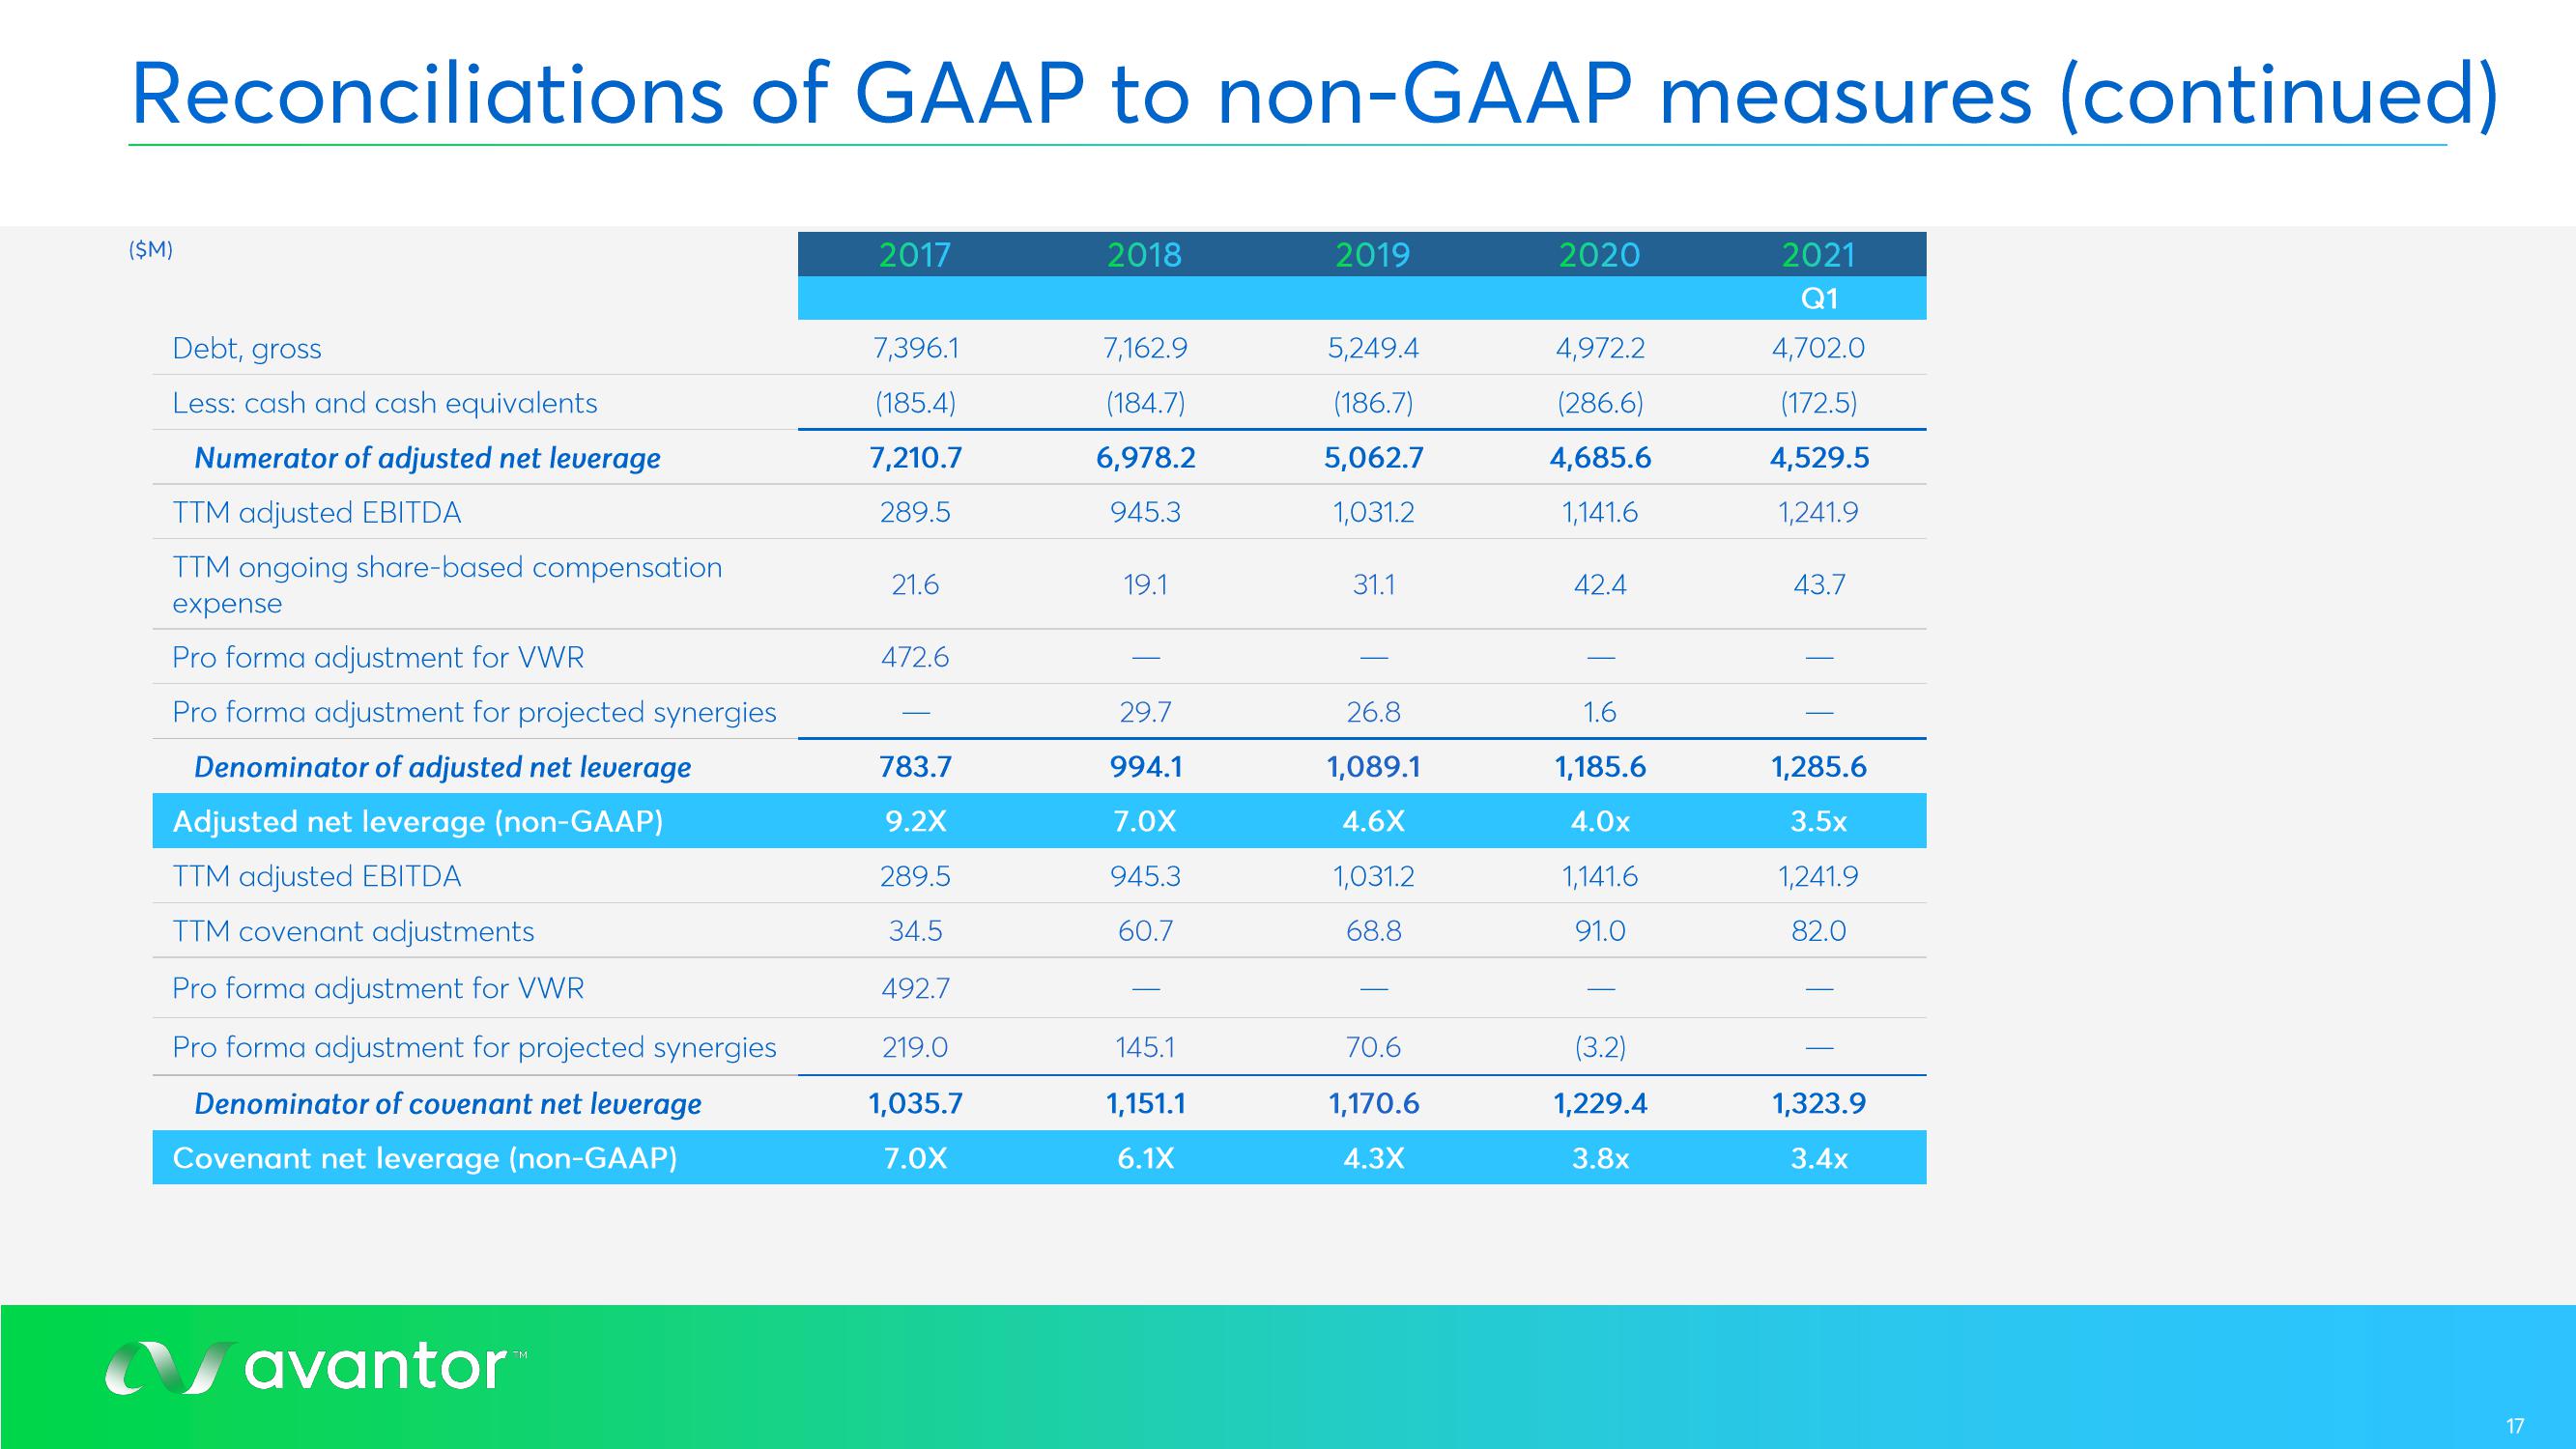
Reconciliations of GAAP to non-GAAP measures (continued)
($M)
Debt, gross
Less: cash and cash equivalents
Numerator of adjusted net leverage
TTM adjusted EBITDA
TTM ongoing share-based compensation
expense
Pro forma adjustment for VWR
Pro forma adjustment for projected synergies
Denominator of adjusted net leverage
Adjusted net leverage (non-GAAP)
TTM adjusted EBITDA
TTM covenant adjustments
Pro forma adjustment for VWR
Pro forma adjustment for projected synergies
Denominator of covenant net leverage
Covenant net leverage (non-GAAP)
avantor™
2017
7,396.1
(185.4)
7,210.7
289.5
21.6
472.6
783.7
9.2X
289.5
34.5
492.7
219.0
1,035.7
7.0X
2018
7,162.9
(184.7)
6,978.2
945.3
19.1
29.7
994.1
7.0X
945.3
60.7
145.1
1,151.1
6.1X
2019
5,249.4
(186.7)
5,062.7
1,031.2
31.1
26.8
1,089.1
4.6X
1,031.2
68.8
70.6
1,170.6
4.3X
2020
4,972.2
(286.6)
4,685.6
1,141.6
42.4
1.6
1,185.6
4.0x
1,141.6
91.0
(3.2)
1,229.4
3.8x
2021
Q1
4,702.0
(172.5)
4,529.5
1,241.9
43.7
1,285.6
3.5x
1,241.9
82.0
1,323.9
3.4x
17View entire presentation