Nexters Results Presentation Deck
Key financial highlights (2/2)
$m
Selling and Marketing Expenses
6
35
Q2 2022
91
H1 2022
+46%
+41%
51
Q2 2023
129
HT 2023
Source: Company information
$m
G&A Expenses
7
Q2 2022
15
+7%
H1 2022
+0%
7
Q2 2023
15
II
HT 2023
$m
Total Costs and Expenses, excl. D&A
91
Q2 2022
199
HT 2022
+8%
+16%
99
Q2 2023
230
HT 2023
GDEU
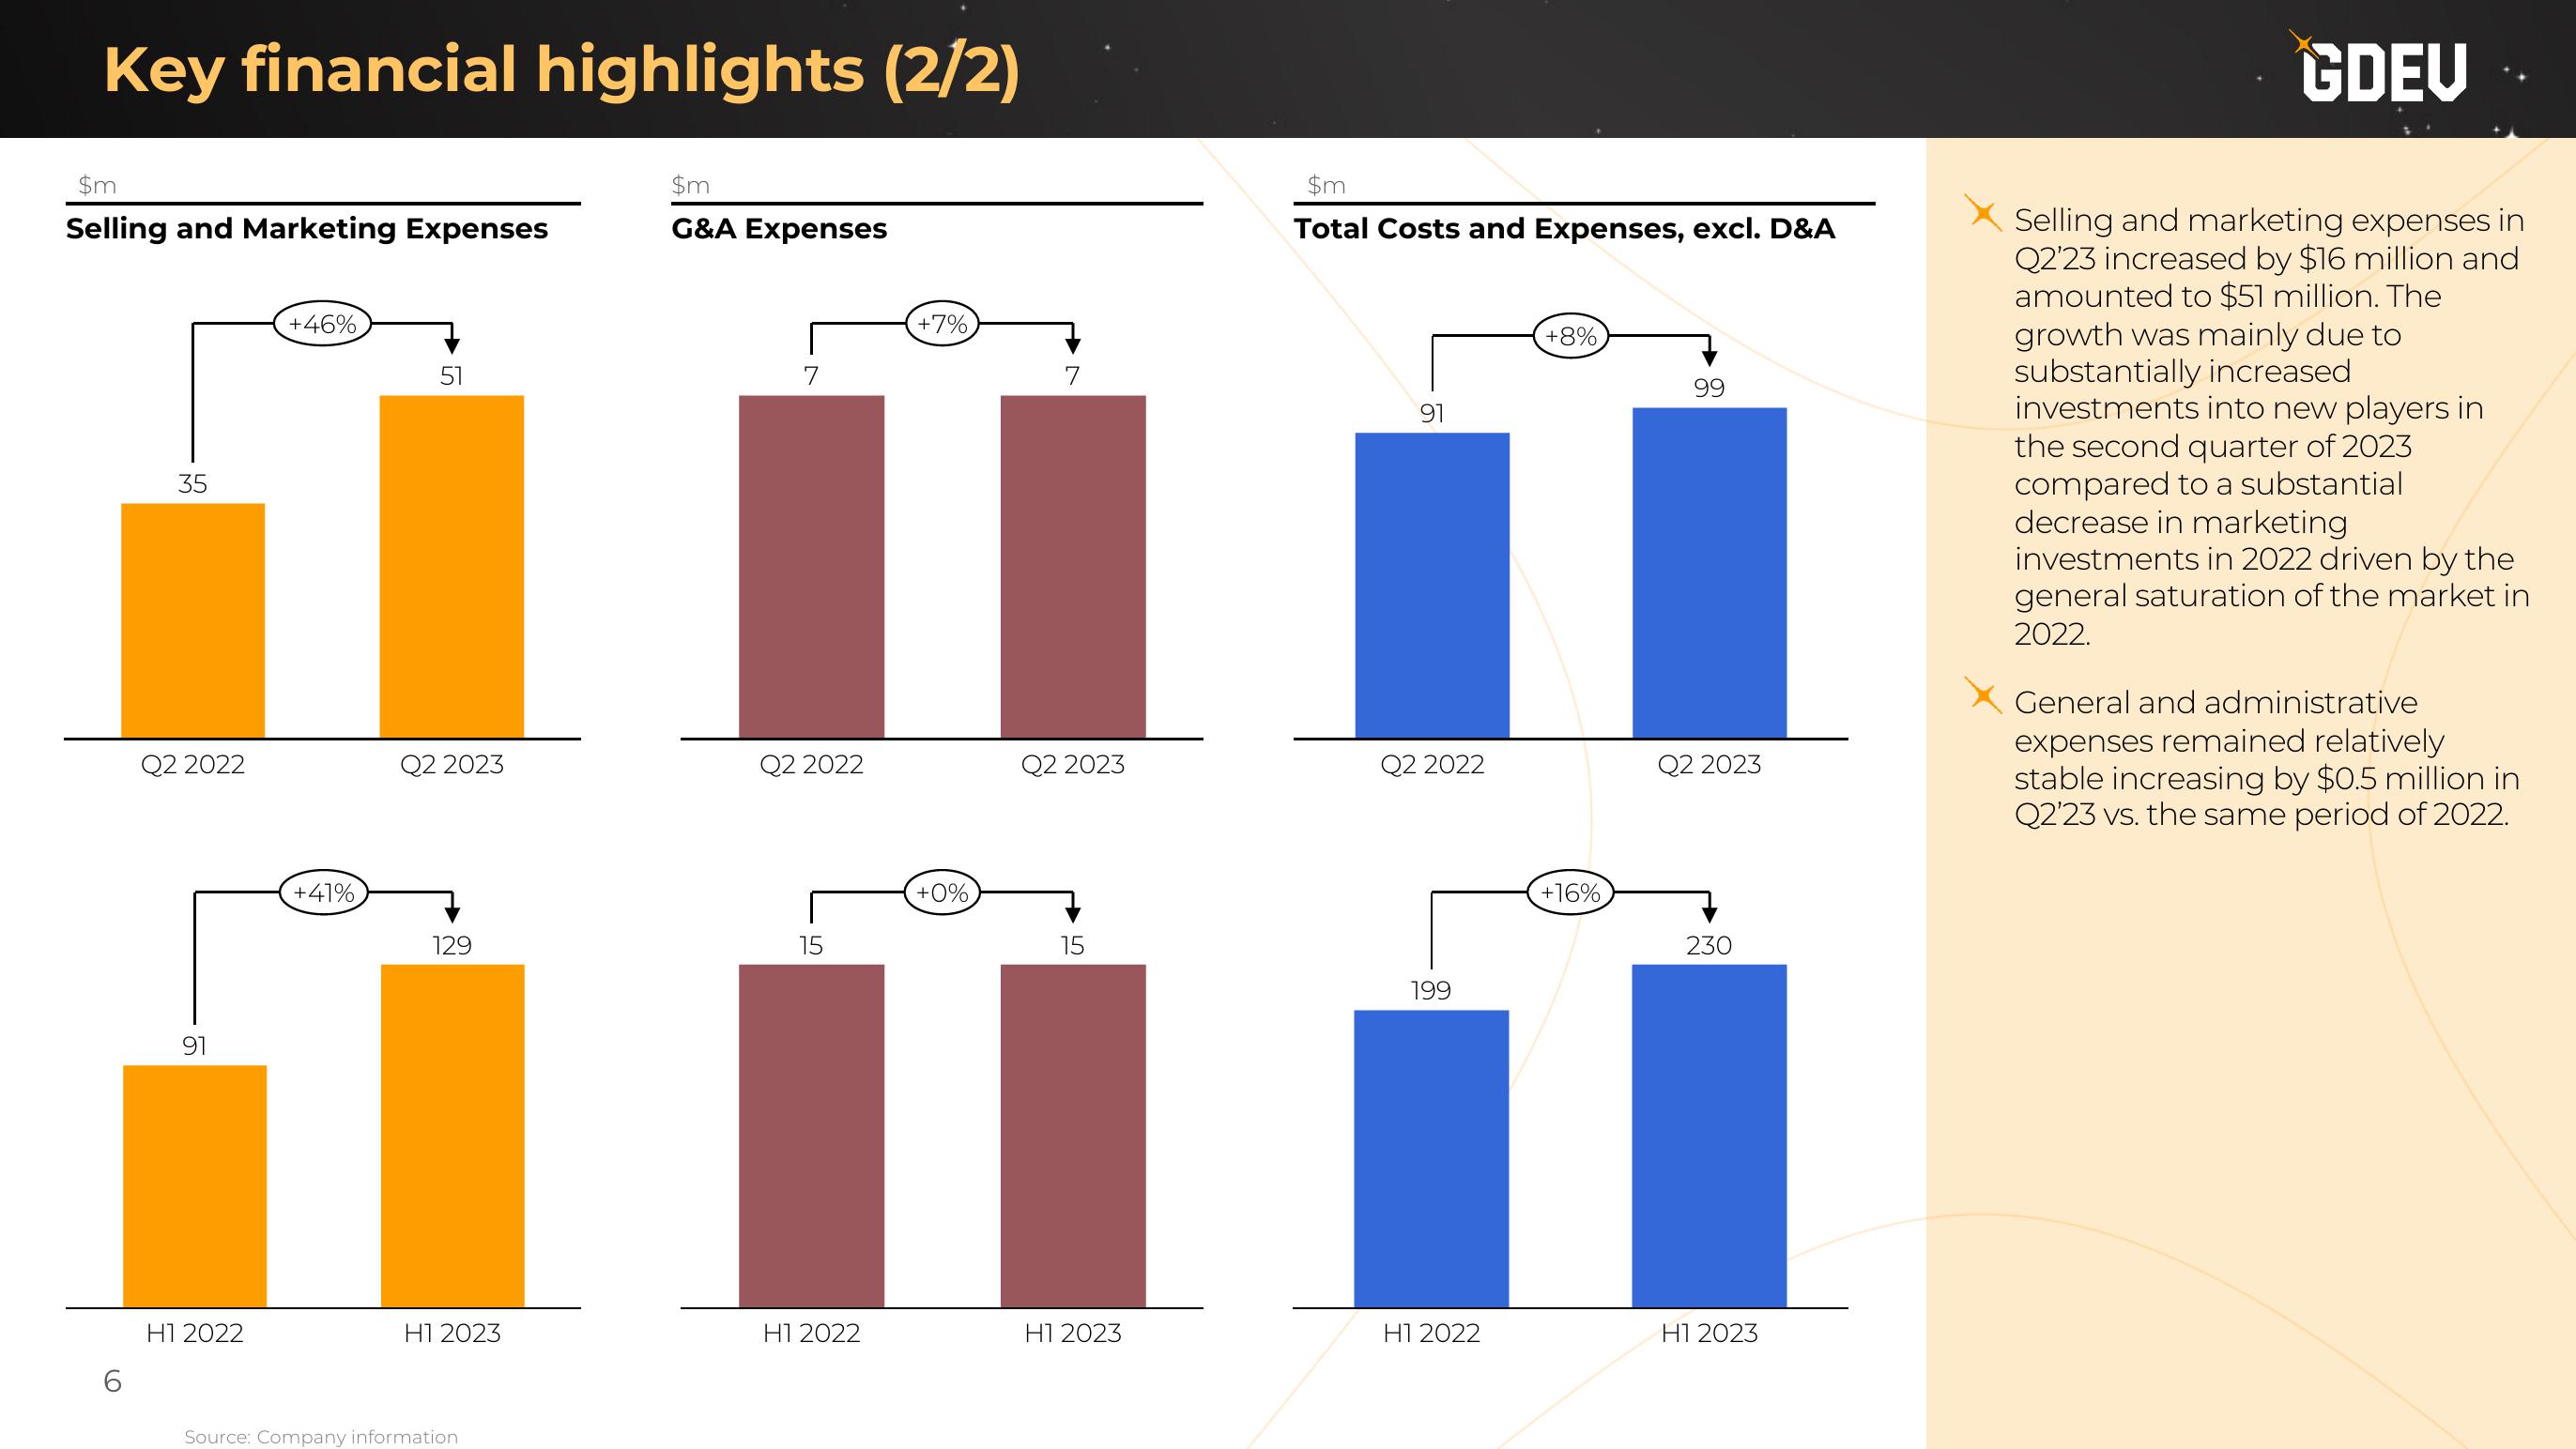
Selling and marketing expenses in
Q2'23 increased by $16 million and
amounted to $51 million. The
growth was mainly due to
substantially increased
investments into new players in
the second quarter of 2023
compared to a substantial
decrease in marketing
investments in 2022 driven by the
general saturation of the market in
2022.
General and administrative
expenses remained relatively
stable increasing by $0.5 million in
Q2'23 vs. the same period of 2022.View entire presentation