Bank of America Results Presentation Deck
Notes
A Reserve Build (or Release) is calculated by subtracting net charge-offs for the period from the provision for credit losses recognized in that period. The period-end allowance, or reserve, for
credit losses reflects the beginning of the period allowance adjusted for net charge-offs recorded in that period plus the provision for credit losses recognized in that period.
B
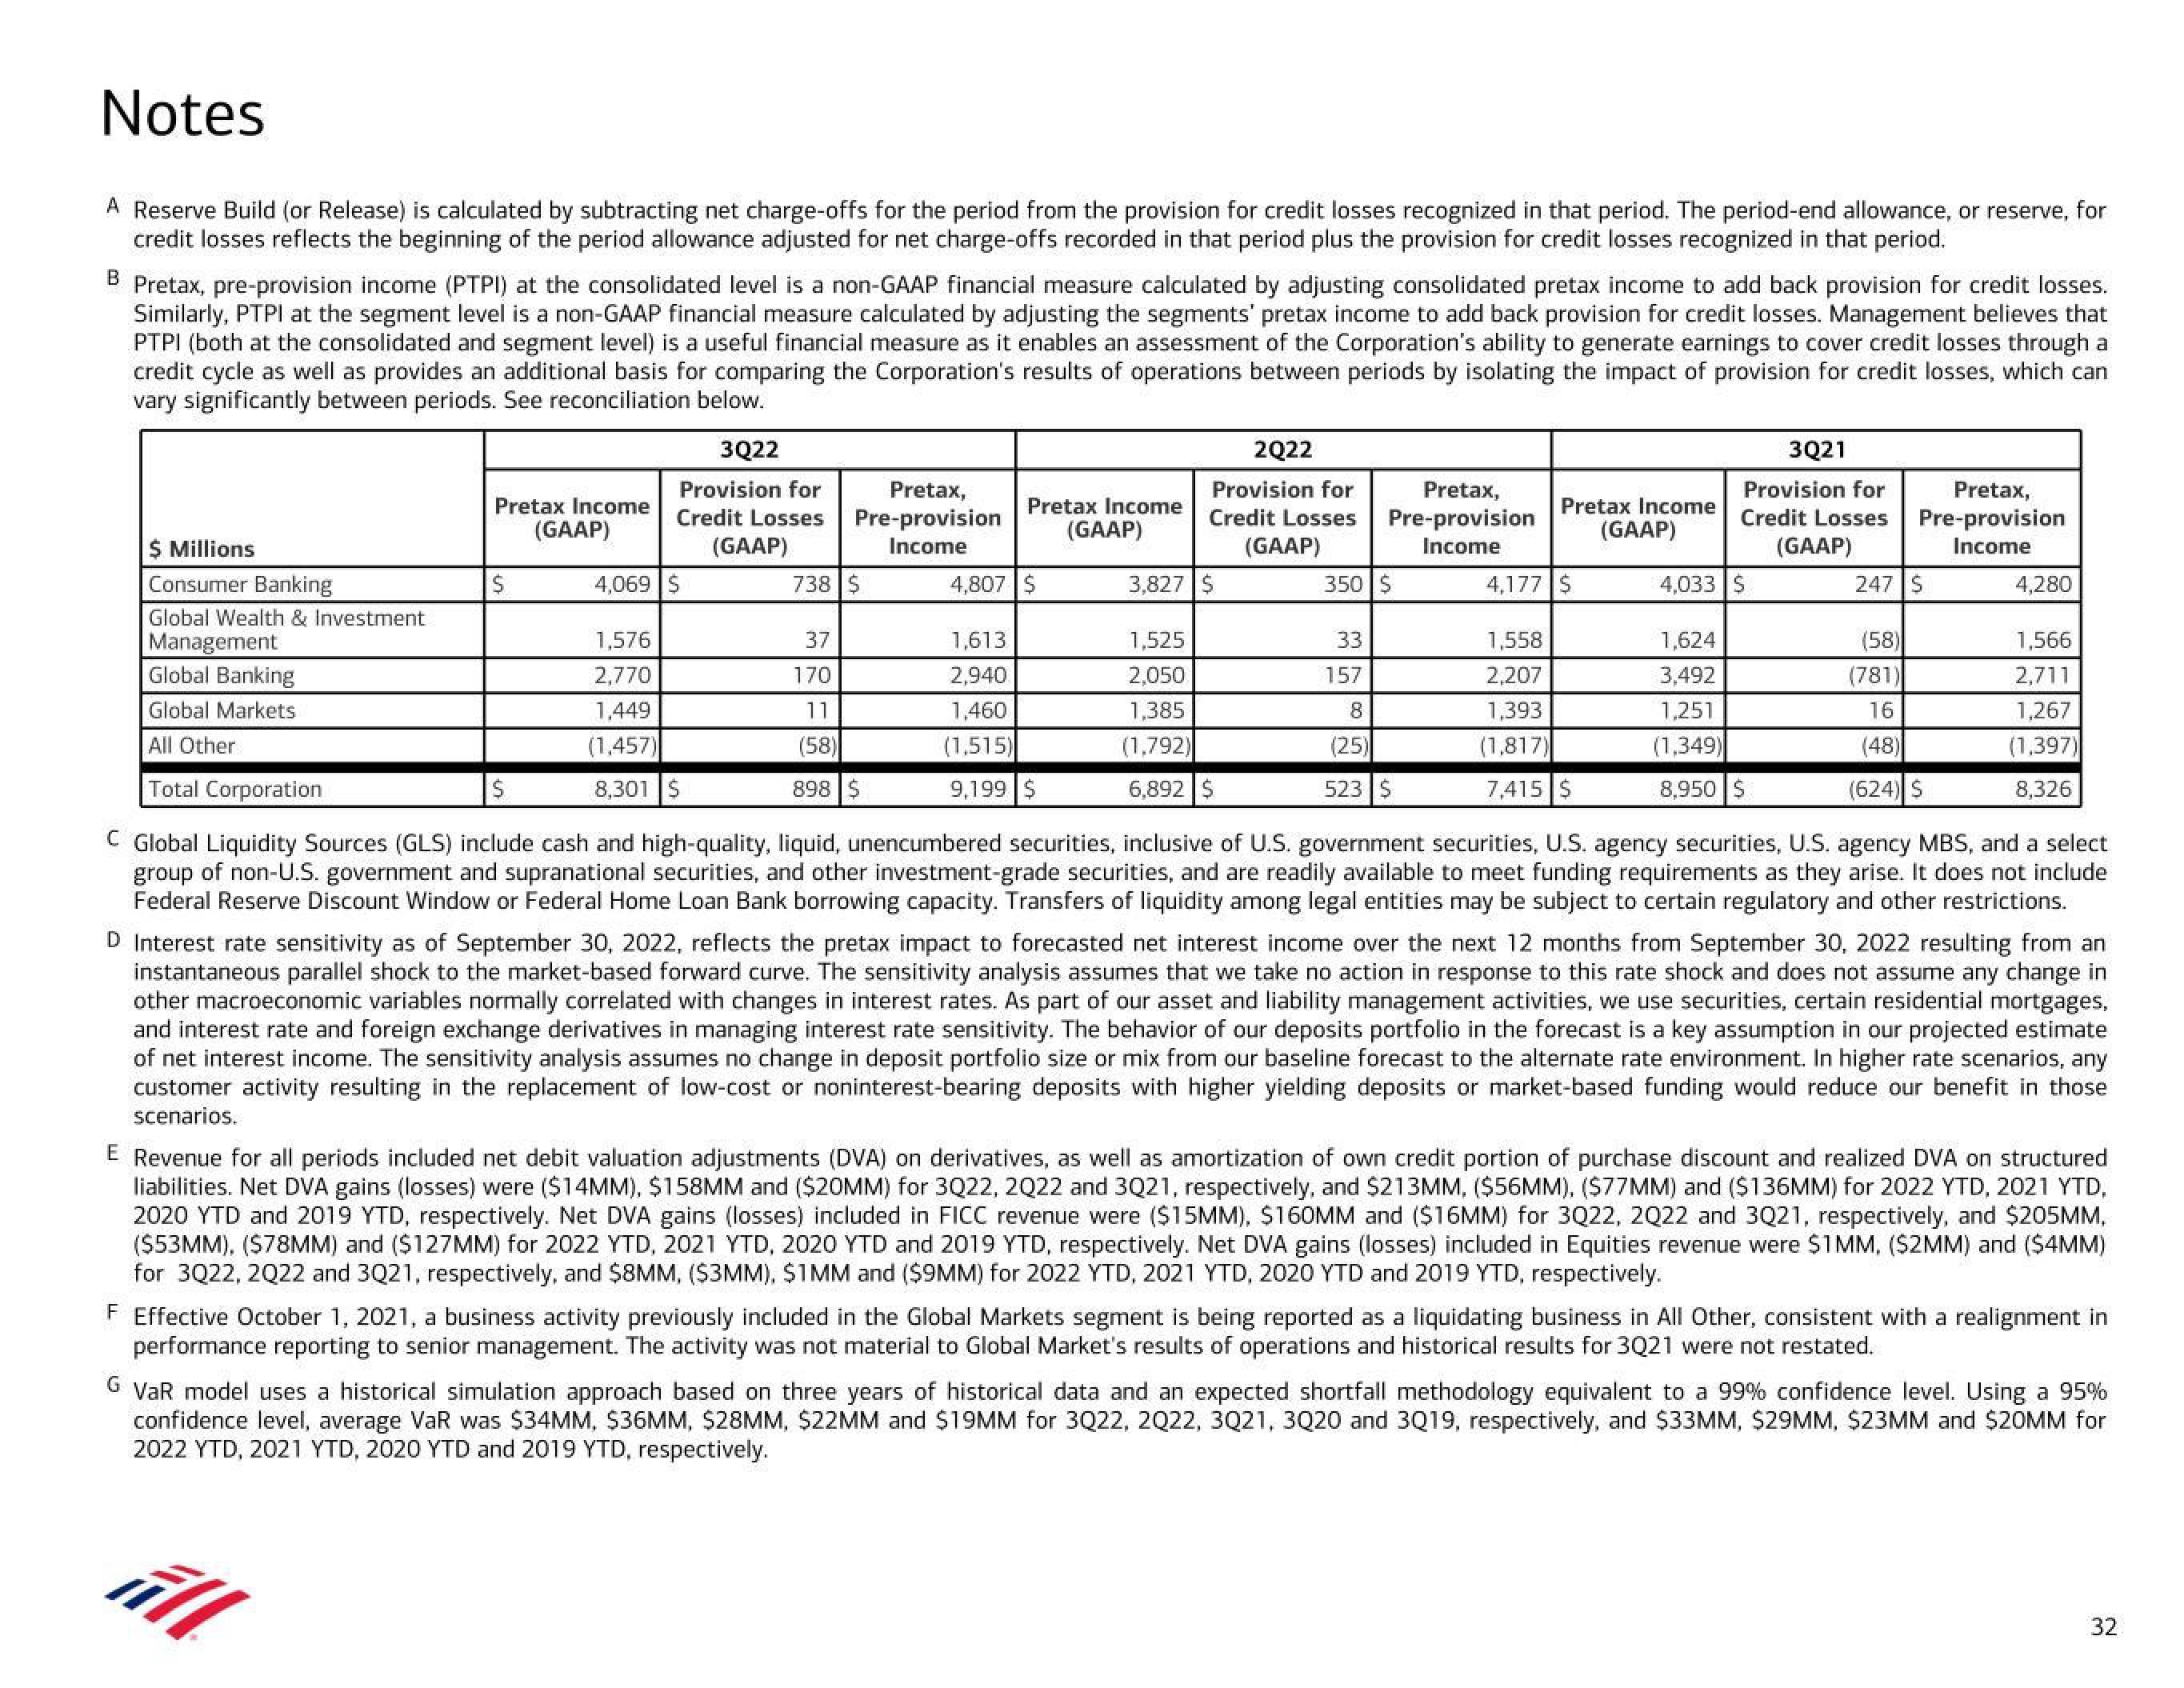
Pretax, pre-provision income (PTPI) at the consolidated level is a non-GAAP financial measure calculated by adjusting consolidated pretax income to add back provision for credit losses.
Similarly, PTPI at the segment level is a non-GAAP financial measure calculated by adjusting the segments' pretax income to add back provision for credit losses. Management believes that
PTPI (both at the consolidated and segment level) is a useful financial measure as it enables an assessment of the Corporation's ability to generate earnings to cover credit losses through a
credit cycle as well as provides an additional basis for comparing the Corporation's results of operations between periods by isolating the impact of provision for credit losses, which can
vary significantly between periods. See reconciliation below.
$ Millions
Consumer Banking
Global Wealth & Investment
Management
Global Banking
Global Markets
All Other
Pretax Income
(GAAP)
$
3Q22
Provision for
Credit Losses
(GAAP)
4,069 $
1,576
2,770
1,449
(1,457)
8,301 $
Pretax,
Pre-provision
Income
738 $
37
170
11
(58)
898 $
Pretax Income
(GAAP)
4,807 $
1,613
2,940
1,460
(1,515)
9,199 $
Pretax,
2Q22
Provision for
Credit Losses Pre-provision
(GAAP)
Income
3,827 $
1,525
2,050
1,385
(1,792)
6,892 $
350 $
33
157
8
(25)
523 $
Pretax Income
(GAAP)
4,177 $
1,558
2,207
1,393
(1,817)
7,415 $
3Q21
Provision for
Credit Losses
(GAAP)
4,033 $
1,624
3,492
1,251
(1,349)
8,950 $
Pretax,
Pre-provision
Income
247 $
(58)
(781)
16
(48)
(624) $
4,280
1,566
2,711
1,267
(1,397)
8,326
Total Corporation
C Global Liquidity Sources (GLS) include cash and high-quality, liquid, unencumbered securities, inclusive of U.S. government securities, U.S. agency securities, U.S. agency MBS, and a select
group of non-U.S. government and supranational securities, and other investment-grade securities, and are readily available to meet funding requirements as they arise. It does not include
Federal Reserve Discount Window or Federal Home Loan Bank borrowing capacity. Transfers of liquidity among legal entities may be subject to certain regulatory and other restrictions.
G VaR model uses a historical simulation approach based on three years of historical data and an expected shortfall methodology equivalent to a 99% confidence level. Using a 95%
confidence level, average VaR was $34MM, $36MM, $28MM, $22MM and $19MM for 3Q22, 2022, 3Q21, 3020 and 3Q19, respectively, and $33MM, $29MM, $23MM and $20MM for
2022 YTD, 2021 YTD, 2020 YTD and 2019 YTD, respectively.
ill
D Interest rate sensitivity as of September 30, 2022, reflects the pretax impact to forecasted net interest income over the next 12 months from September 30, 2022 resulting from an
instantaneous parallel shock to the market-based forward curve. The sensitivity analysis assumes that we take no action in response to this rate shock and does not assume any change in
other macroeconomic variables normally correlated with changes in interest rates. As part of our asset and liability management activities, we use securities, certain residential mortgages,
and interest rate and foreign exchange derivatives in managing interest rate sensitivity. The behavior of our deposits portfolio in the forecast is a key assumption in our projected estimate
of net interest income. The sensitivity analysis assumes no change in deposit portfolio size or mix from our baseline forecast to the alternate rate environment. In higher rate scenarios, any
customer activity resulting in the replacement of low-cost or noninterest-bearing deposits with higher yielding deposits or market-based funding would reduce our benefit in those
scenarios.
E Revenue for all periods included net debit valuation adjustments (DVA) on derivatives, as well as amortization of own credit portion of purchase discount and realized DVA on structured
liabilities. Net DVA gains (losses) were ($14MM), $158MM and ($20MM) for 3Q22, 2Q22 and 3Q21, respectively, and $213MM, ($56MM), ($77MM) and ($136MM) for 2022 YTD, 2021 YTD,
2020 YTD and 2019 YTD, respectively. Net DVA gains (losses) included in FICC revenue were ($15MM), $160MM and ($16MM) for 3Q22, 2022 and 3Q21, respectively, and $205MM,
($53MM), ($78MM) and ($127MM) for 2022 YTD, 2021 YTD, 2020 YTD and 2019 YTD, respectively. Net DVA gains (losses) included in Equities revenue were $1MM, ($2MM) and ($4MM)
for 3Q22, 2022 and 3Q21, respectively, and $8MM, ($3MM), $1MM and ($9MM) for 2022 YTD, 2021 YTD, 2020 YTD and 2019 YTD, respectively.
F Effective October 1, 2021, a business activity previously included in the Global Markets segment is being reported as a liquidating business in All Other, consistent with a realignment in
performance reporting to senior management. The activity was not material to Global Market's results of operations and historical results for 3Q21 were not restated.
32View entire presentation