Oatly Results Presentation Deck
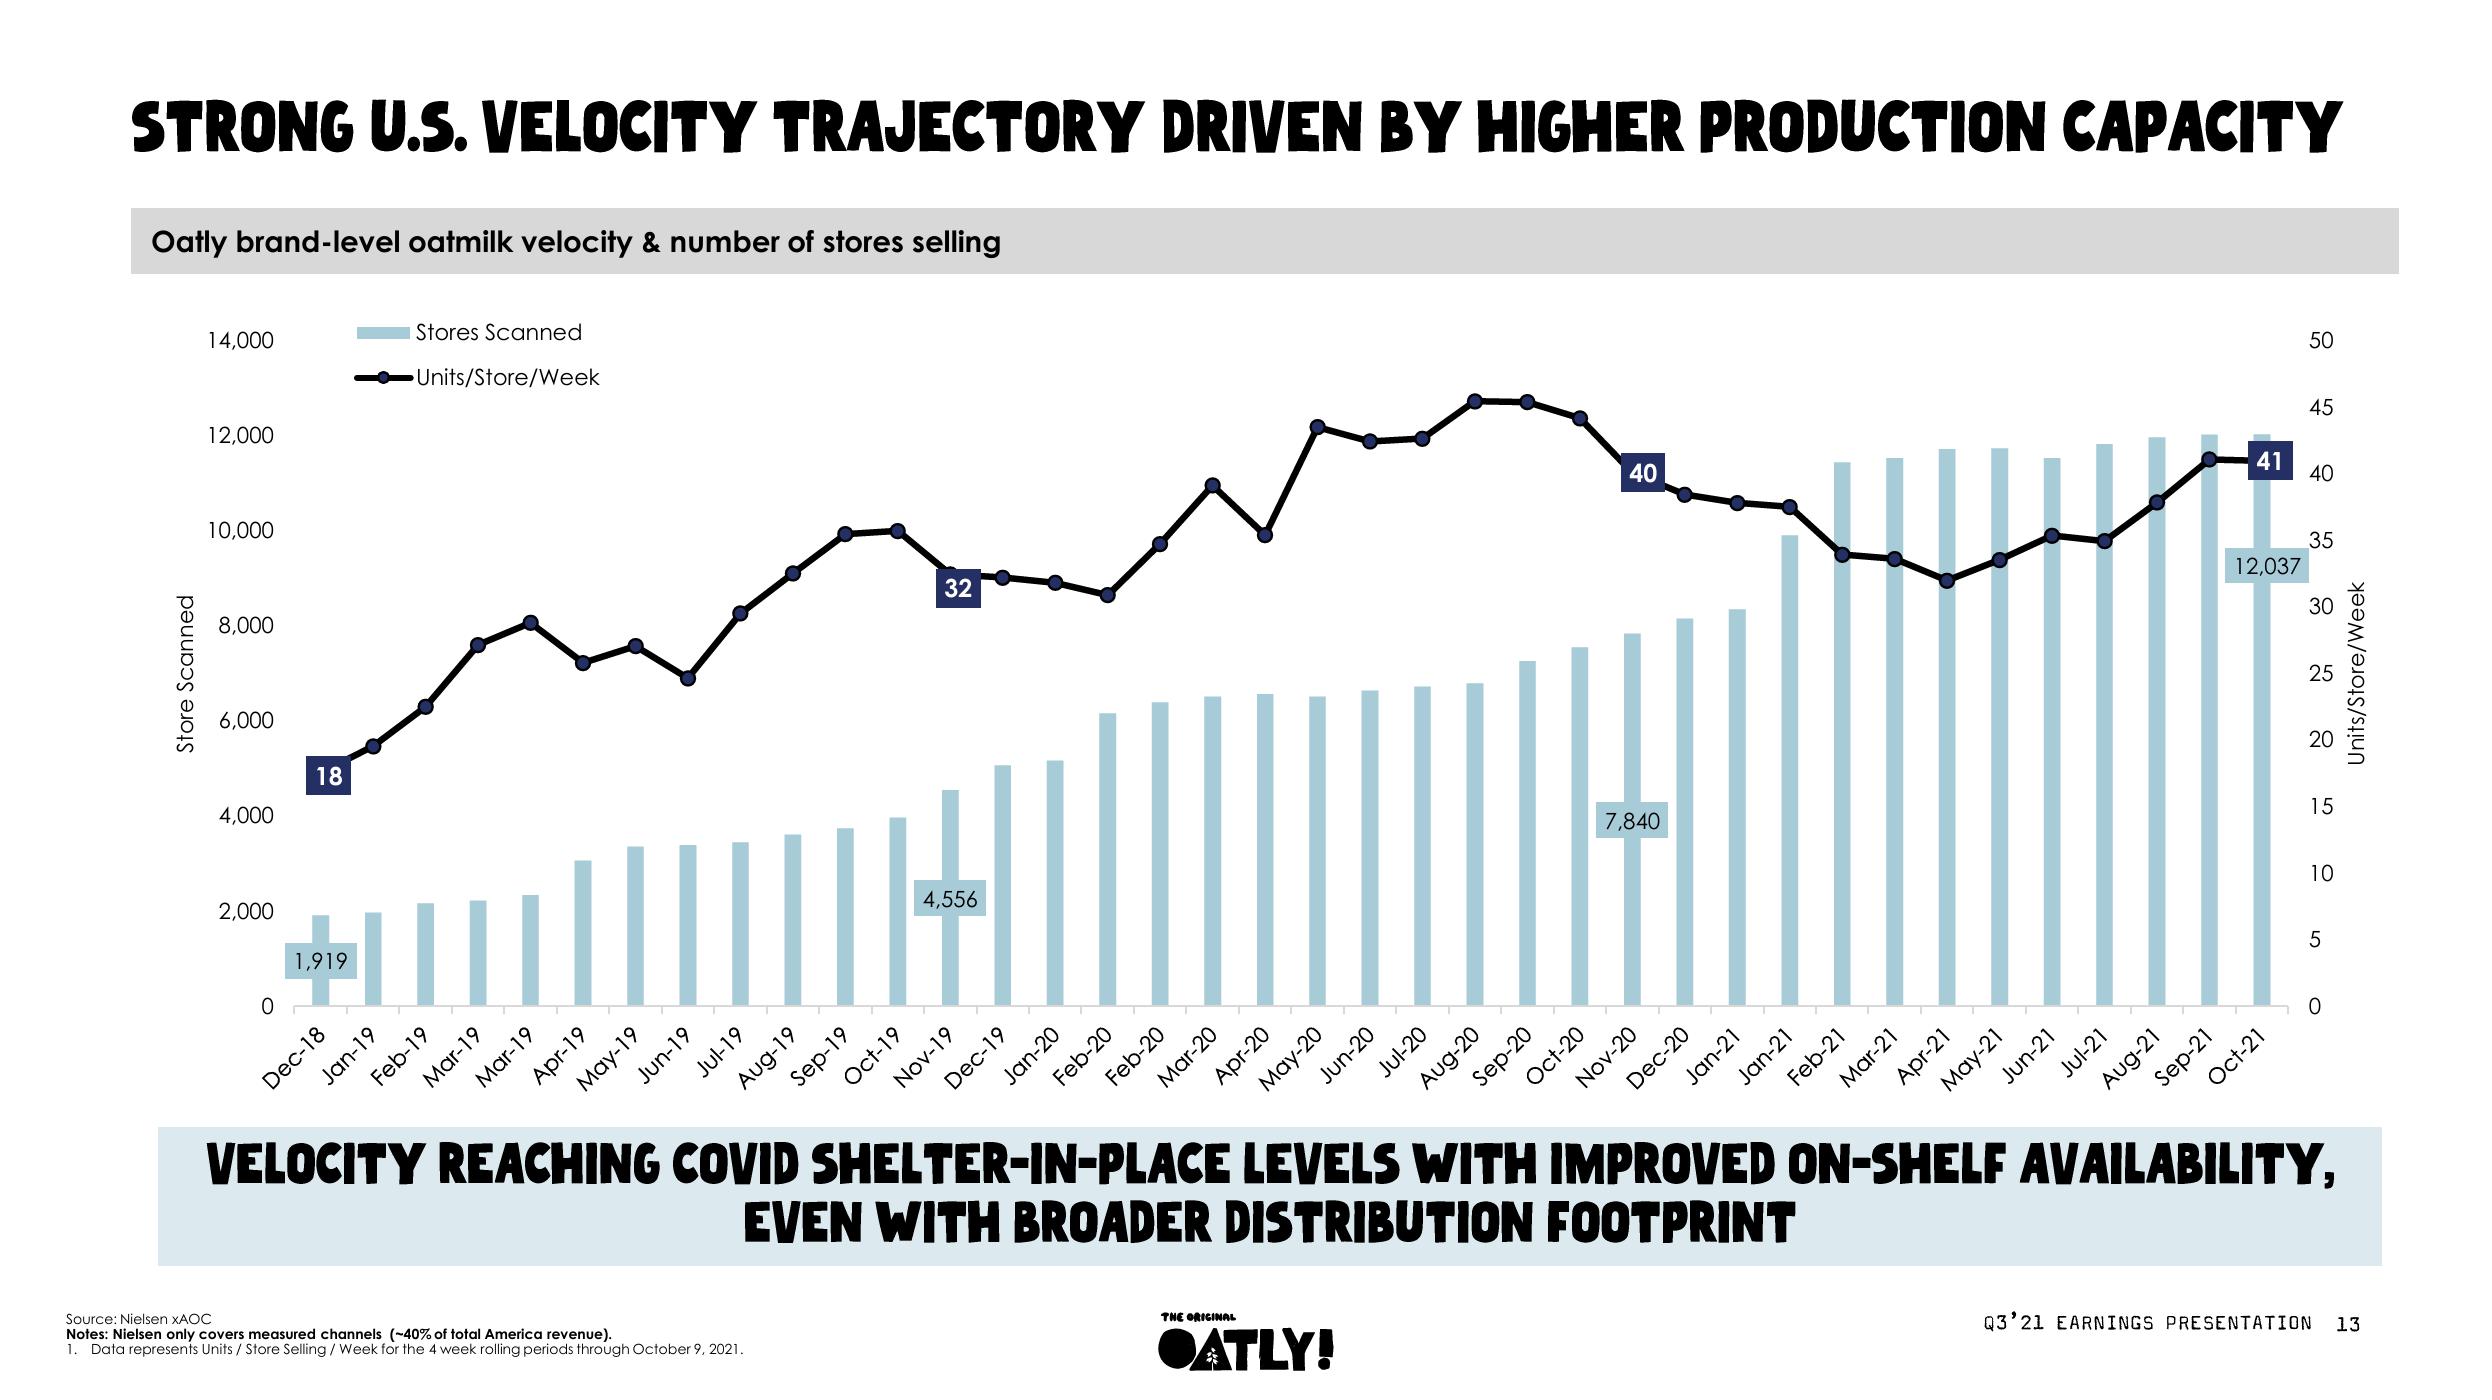
STRONG U.S. VELOCITY TRAJECTORY DRIVEN BY HIGHER PRODUCTION CAPACITY
Oatly brand-level oatmilk velocity & number of stores selling
Store Scanned
14,000
12,000
10,000
8,000
6,000
4,000
2,000
0
18
1,919
Dec-18
Jan-19
Stores Scanned
Units/Store/Week
Feb-19
Mar-19
Mar-19
Apr-19
III
May-19
Jun-19
Jul-19
Aug-19
Source: Nielsen XAOC
Notes: Nielsen only covers measured channels (~40% of total America revenue).
1. Data represents Units / Store Selling / Week for the 4 week rolling periods through October 9, 2021.
Sep-19
Oct-19
32
4,556
Nov-19
Dec-19
Jan-20
Feb-20
Feb-20
Mar-20
Apr-20
THE ORIGINAL
May-20
Jul-20
Jun-20
OATLY!
Aug-20
Sep-20
Oct-20
40
7,840
Nov-20
Dec-20
Jan-21
Jan-21
Feb-21
W
Mar-21
Apr-21
May-21
Jun-21
Jul-21
Aug-21
Sep-21
41
12,037
Oct-21
50
45
40
35
30
25
20
15
10
VELOCITY REACHING COVID SHELTER-IN-PLACE LEVELS WITH IMPROVED ON-SHELF AVAILABILITY,
EVEN WITH BROADER DISTRIBUTION FOOTPRINT
5
0
Units/Store/Week
Q3'21 EARNINGS PRESENTATION 13View entire presentation