Kore Results Presentation Deck
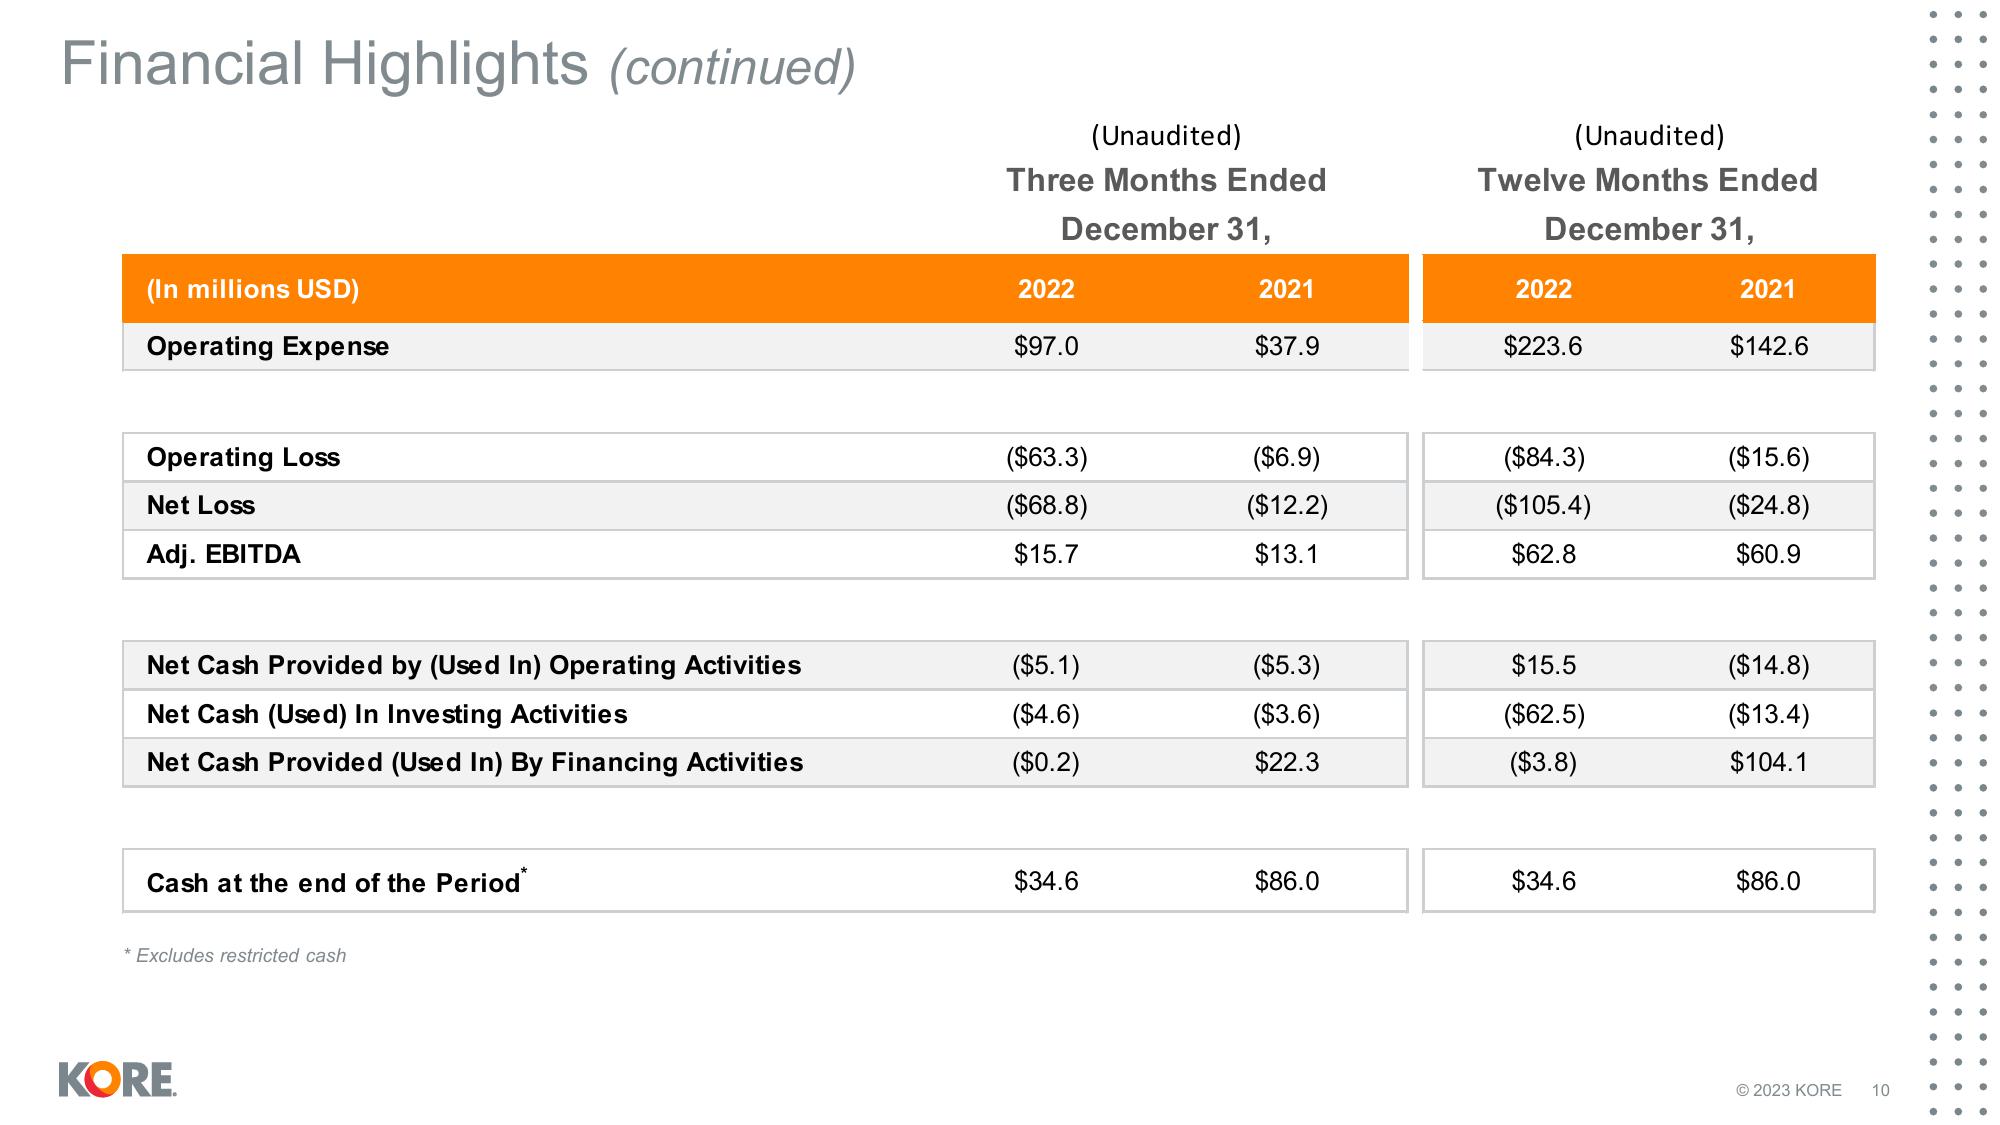
Financial Highlights (continued)
(In millions USD)
Operating Expense
Operating Loss
Net Loss
Adj. EBITDA
Net Cash Provided by (Used In) Operating Activities
Net Cash (Used) In Investing Activities
Net Cash Provided (Used In) By Financing Activities
Cash at the end of the Period*
*Excludes restricted cash
KORE
(Unaudited)
Three Months Ended
December 31,
2022
$97.0
($63.3)
($68.8)
$15.7
($5.1)
($4.6)
($0.2)
$34.6
2021
$37.9
($6.9)
($12.2)
$13.1
($5.3)
($3.6)
$22.3
$86.0
(Unaudited)
Twelve Months Ended
December 31,
2022
$223.6
($84.3)
($105.4)
$62.8
$15.5
($62.5)
($3.8)
$34.6
2021
$142.6
($15.6)
($24.8)
$60.9
($14.8)
($13.4)
$104.1
$86.0
© 2023 KORE 10
● ●
●
●
●
●
•
●
●
●
.. ●
●
●
.. ●
●
●
●
●
●
●
●
●
● ●
●
●
.
•
● ●
● e
0
...
●
●
● ●View entire presentation