Circut Results Presentation Deck
EBITDA¹
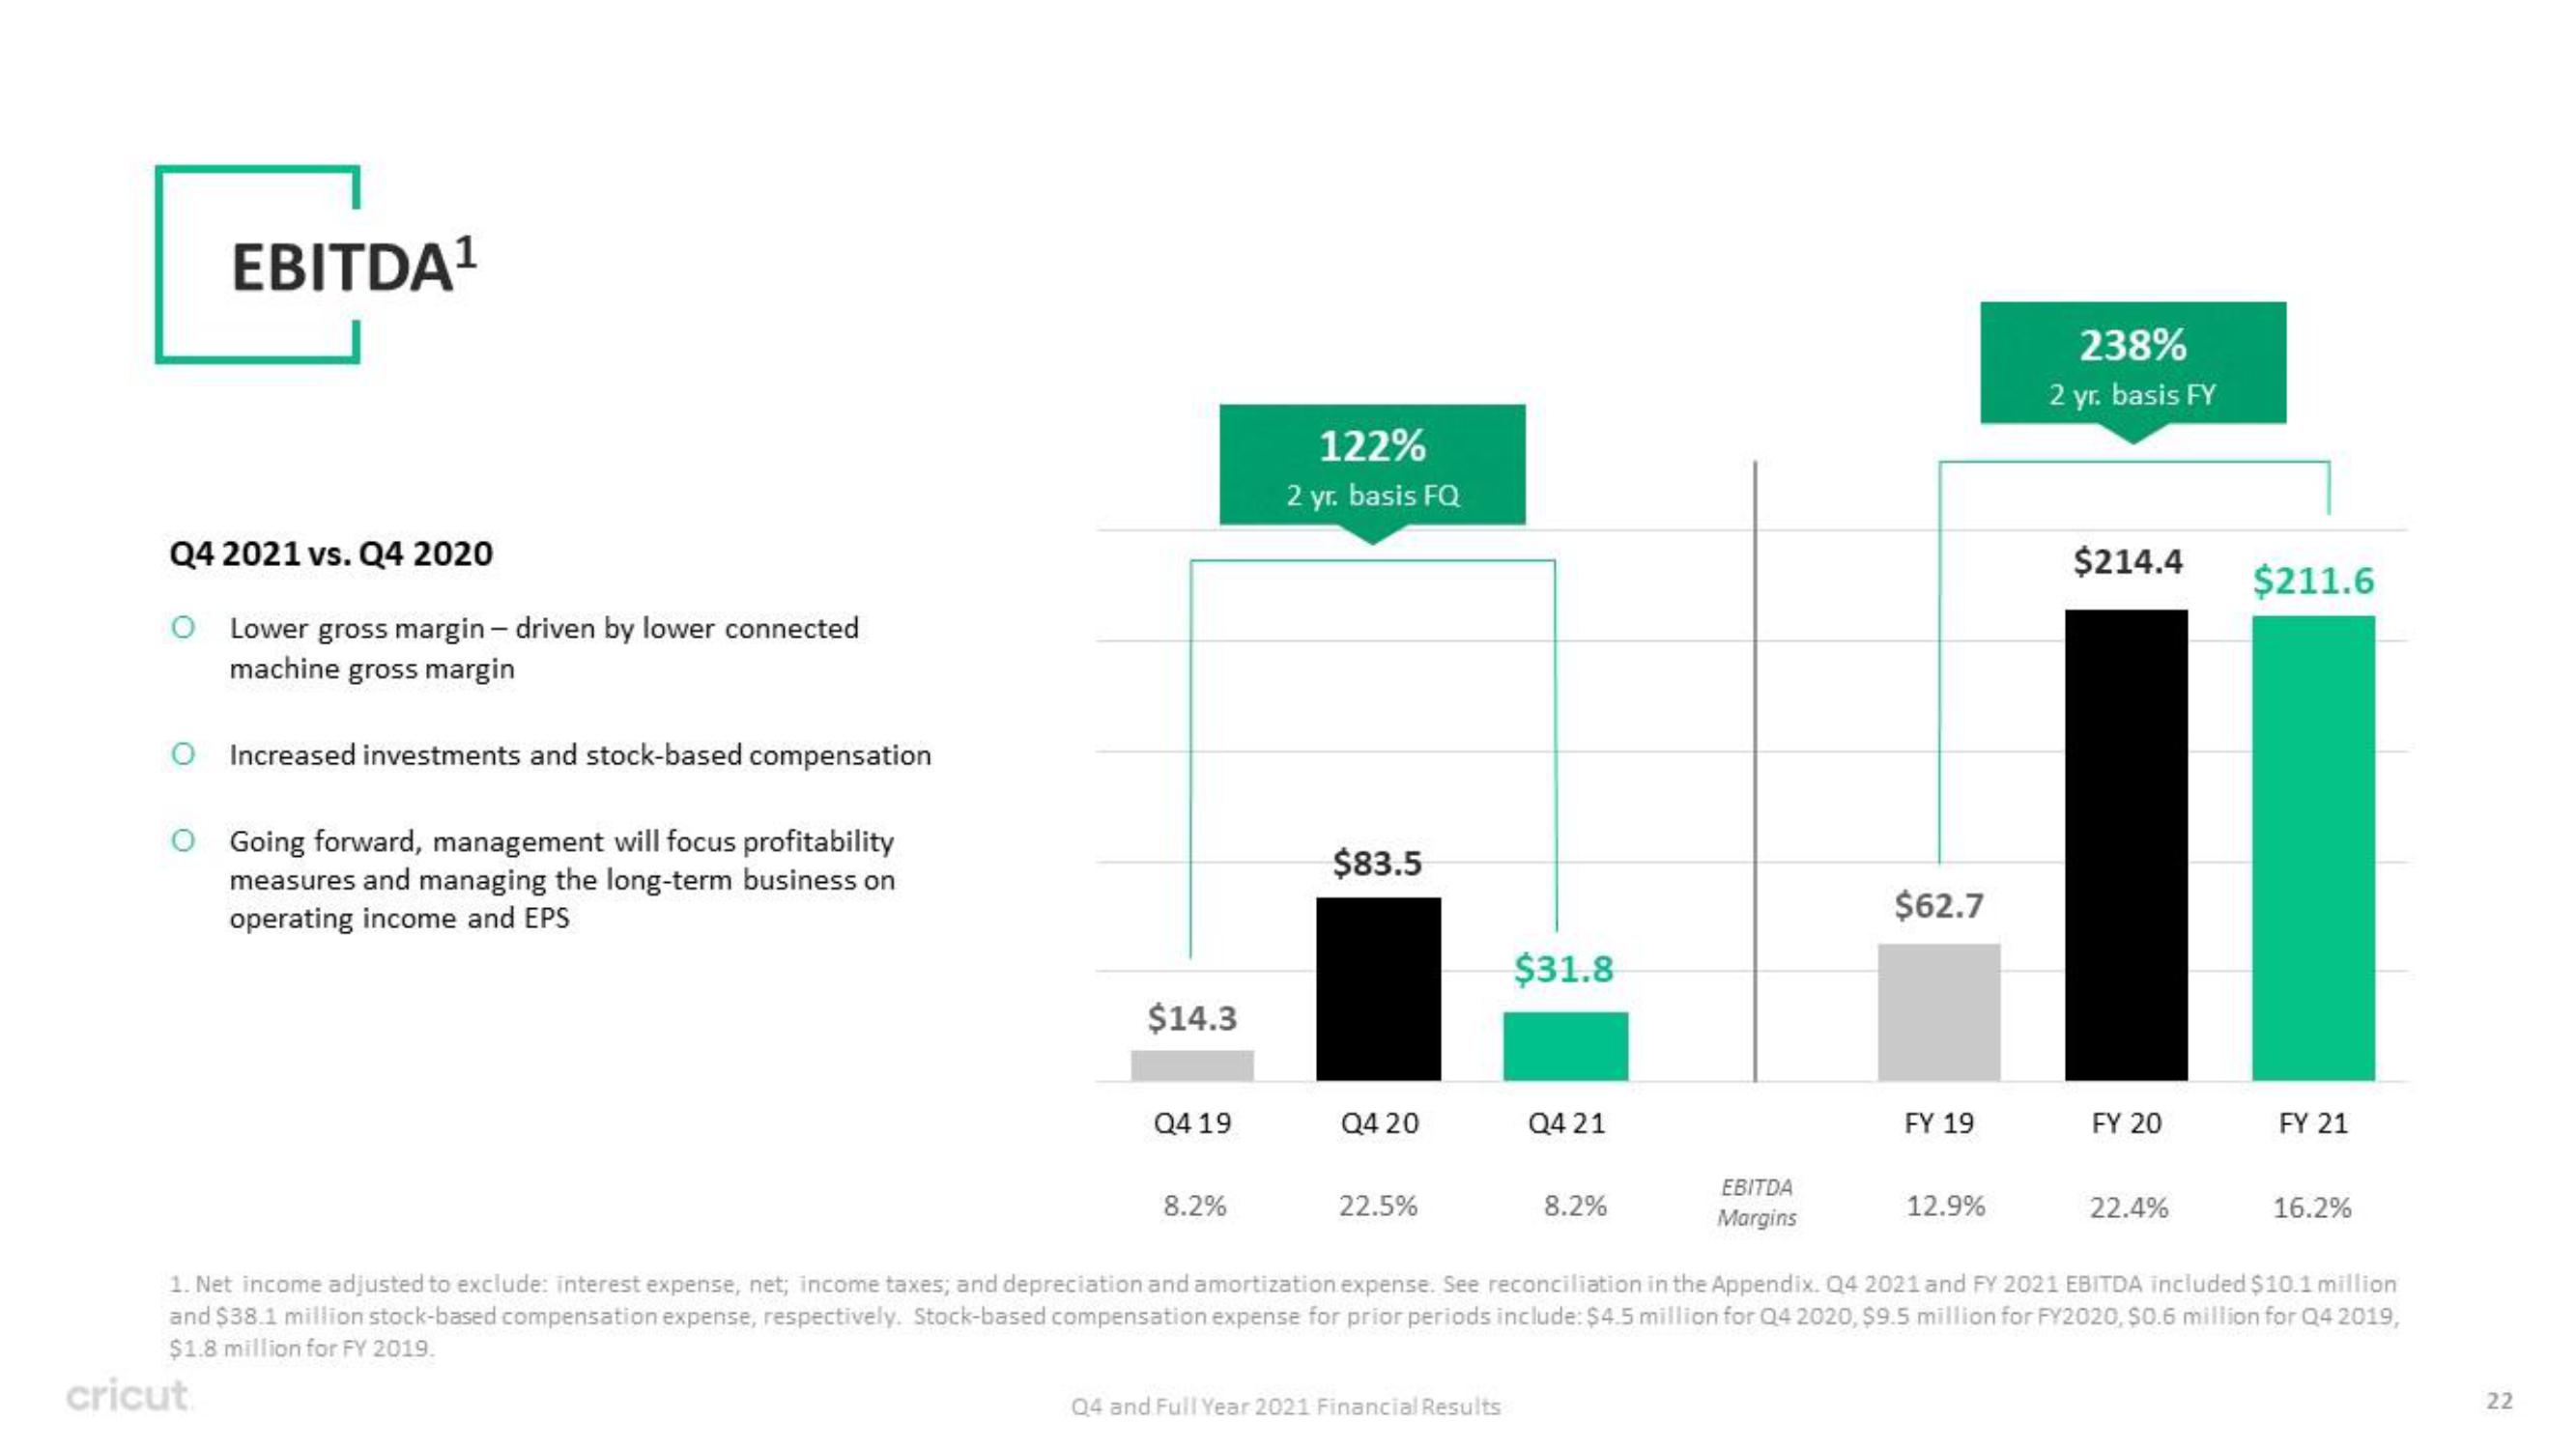
Q4 2021 vs. Q4 2020
O Lower gross margin-driven by lower connected
machine gross margin
Increased investments and stock-based compensation
O Going forward, management will focus profitability
measures and managing the long-term business on
operating income and EPS
$14.3
Q4 19
8.2%
122%
2 yr. basis FQ
$83.5
Q4 20
22.5%
$31.8
Q4 and Full Year 2021 Financial Results
Q4 21
8.2%
EBITDA
Margins
$62.7
FY 19
12.9%
238%
2 yr. basis FY
$214.4
FY 20
22.4%
$211.6
FY 21
16.2%
1. Net income adjusted to exclude: interest expense, net; income taxes; and depreciation and amortization expense. See reconciliation in the Appendix. Q4 2021 and FY 2021 EBITDA included $10.1 million
and $38.1 million stock-based compensation expense, respectively. Stock-based compensation expense for prior periods include: $4.5 million for Q4 2020, $9.5 million for FY2020, $0.6 million for Q4 2019,
$1.8 million for FY 2019.
cricut
22View entire presentation