Blend Results Presentation Deck
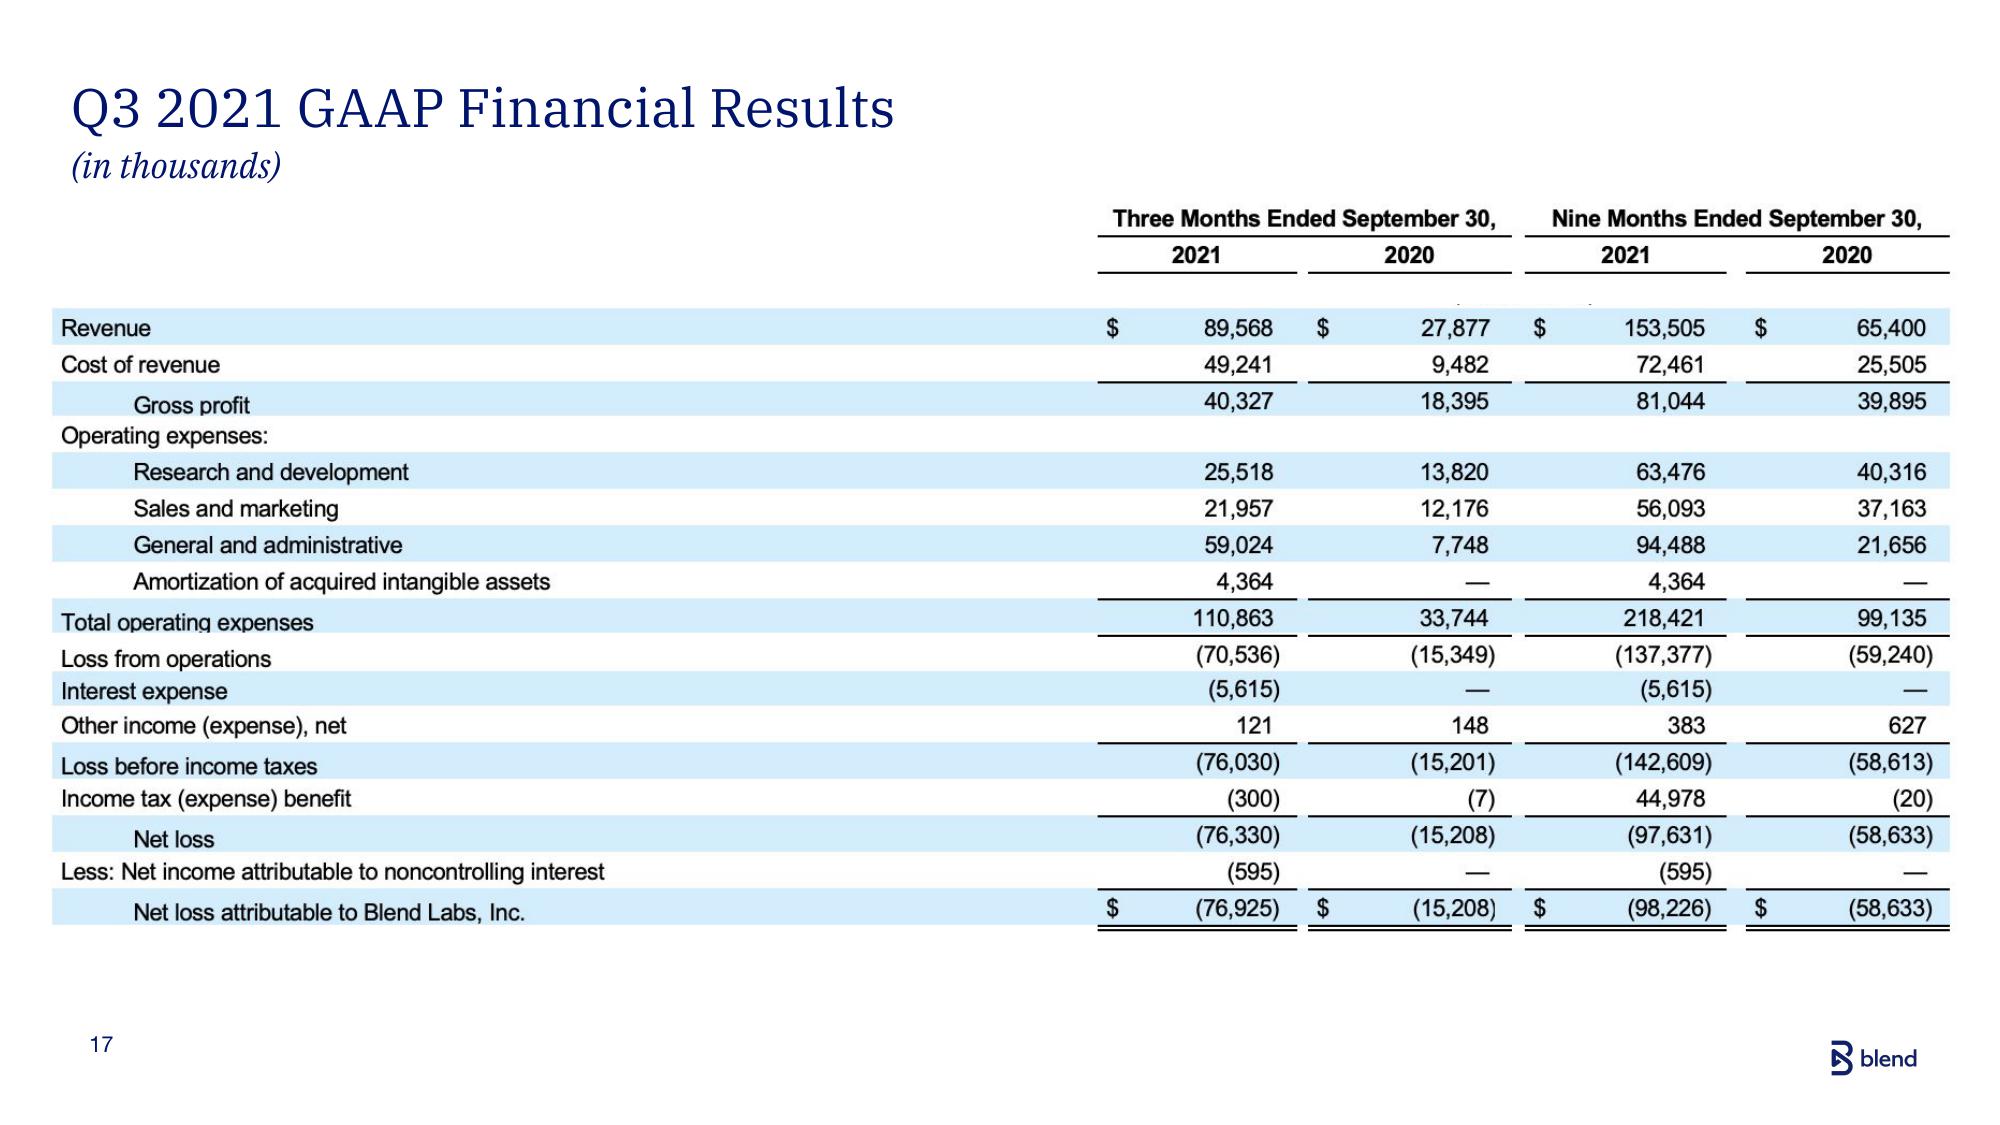
Q3 2021 GAAP Financial Results
(in thousands)
Revenue
Cost of revenue
Gross profit
Operating expenses:
Research and development
Sales and marketing
General and administrative
Amortization of acquired intangible assets
Total operating expenses
Loss from operations
Interest expense
Other income (expense), net
Loss before income taxes
Income tax (expense) benefit
Net loss
Less: Net income attributable to noncontrolling interest
Net loss attributable to Blend Labs, Inc.
17
Three Months Ended September 30,
2021
2020
$
$
89,568 $
49,241
40,327
25,518
21,957
59,024
4,364
110,863
(70,536)
(5,615)
121
(76,030)
(300)
(76,330)
(595)
(76,925)
$
27,877
9,482
18,395
13,820
12,176
7,748
33,744
(15,349)
148
(15,201)
(7)
(15,208)
$
(15,208) $
Nine Months Ended September 30,
2021
2020
153,505 $
72,461
81,044
63,476
56,093
94,488
4,364
218,421
(137,377)
(5,615)
383
(142,609)
44,978
(97,631)
(595)
(98,226)
$
65,400
25,505
39,895
40,316
37,163
21,656
99,135
(59,240)
627
(58,613)
(20)
(58,633)
(58,633)
blendView entire presentation