Commercial Metals Company Investor Presentation Deck
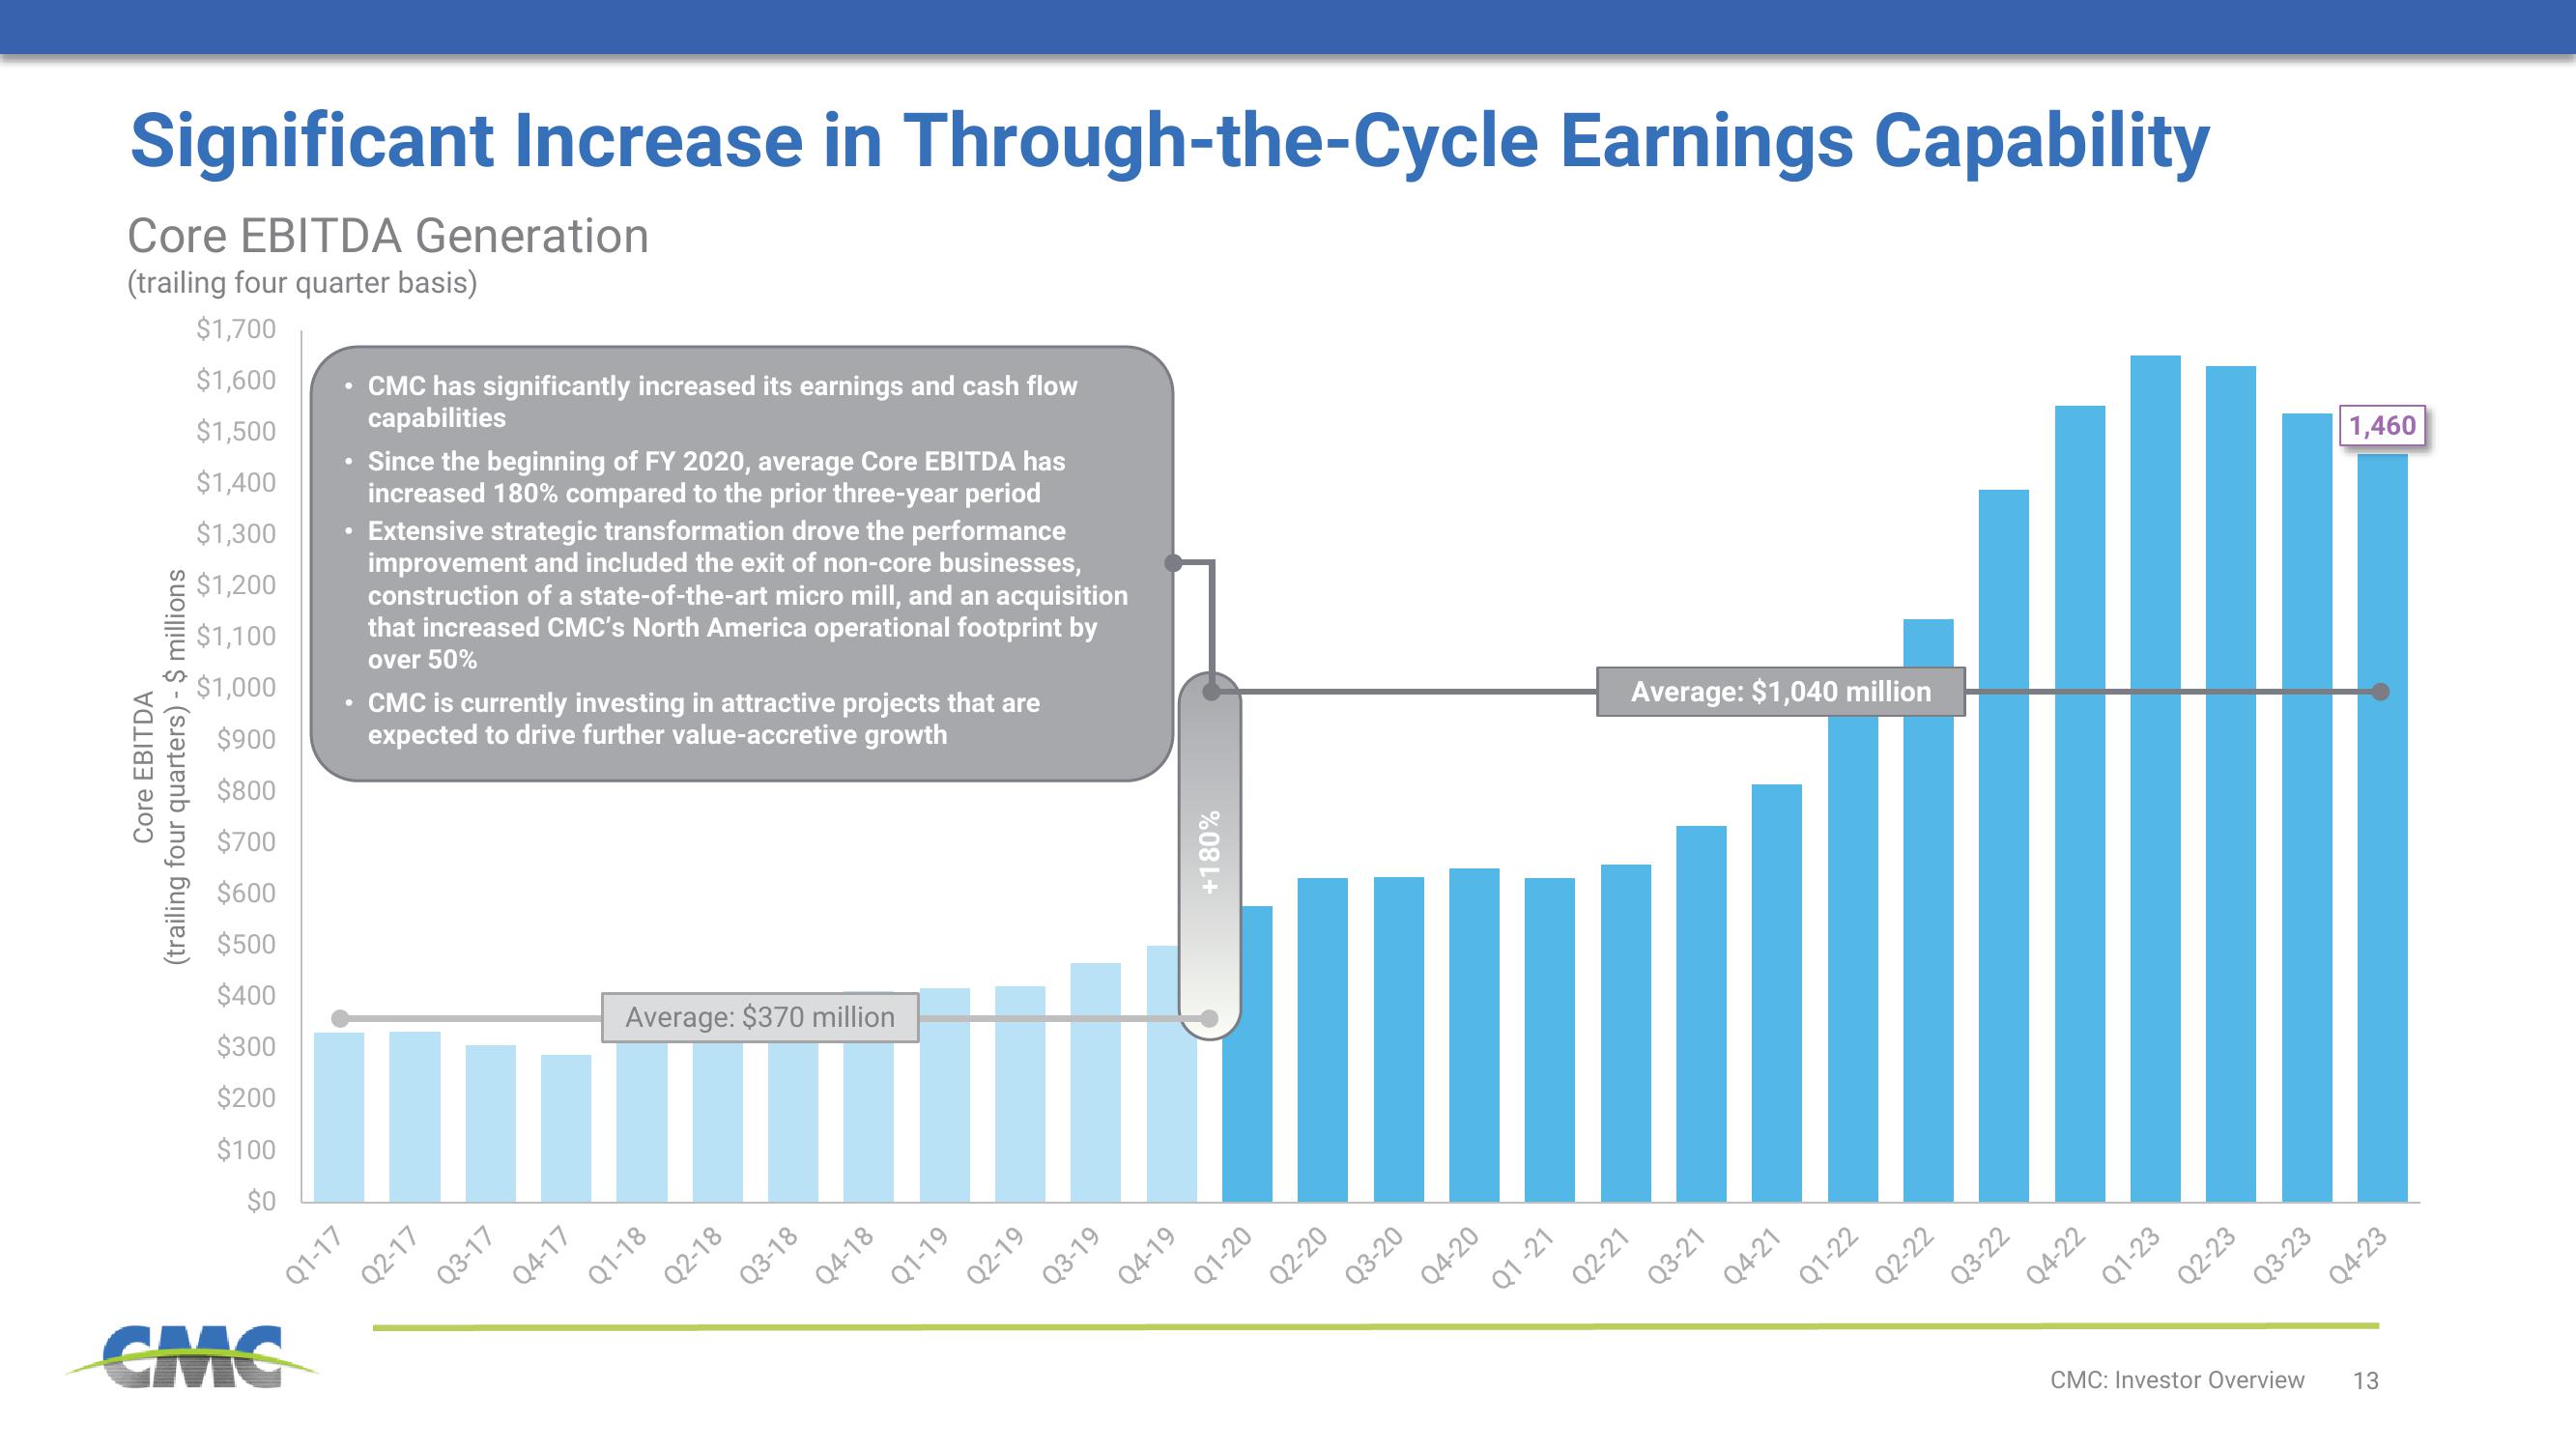
Significant Increase in Through-the-Cycle Earnings Capability
Core EBITDA Generation
(trailing four quarter basis)
$1,700
$1,600
$1,500
$1,400
$1,300
$1,200
$1,100
$1,000
$900
$800
$700
$600
$500
$400
$300
$200
$100
$0
Core EBITDA
(trailing four quarters) - $ millions
CMC has significantly increased its earnings and cash flow
capabilities
Q1-17
Since the beginning of FY 2020, average Core EBITDA has
increased 180% compared to the prior three-year period
Extensive strategic transformation drove the performance
improvement and included the exit of non-core businesses,
construction of a state-of-the-art micro mill, and an acquisition
that increased CMC's North America operational footprint by
over 50%
• CMC is currently investing in attractive projects that are
expected to drive further value-accretive growth
Q2-17
Q3-17
Q4-17
Average: $370 million
Q1-18
Q2-18
Q3-18
Q4-18
Q1-19
Q2-19
Q3-19
Q4-19
+180%
Q1-20
Q2-20
Q3-20
Q4-20
Q1-21
Average: $1,040 million
Q2-21
Q3-21
Q4-21
Q1-22
Q2-22
Q3-22
Q4-22
Q1-23
Q2-23
Q3-23
CMC: Investor Overview
1,460
Q4-23
13View entire presentation