Affirm Results Presentation Deck
Income
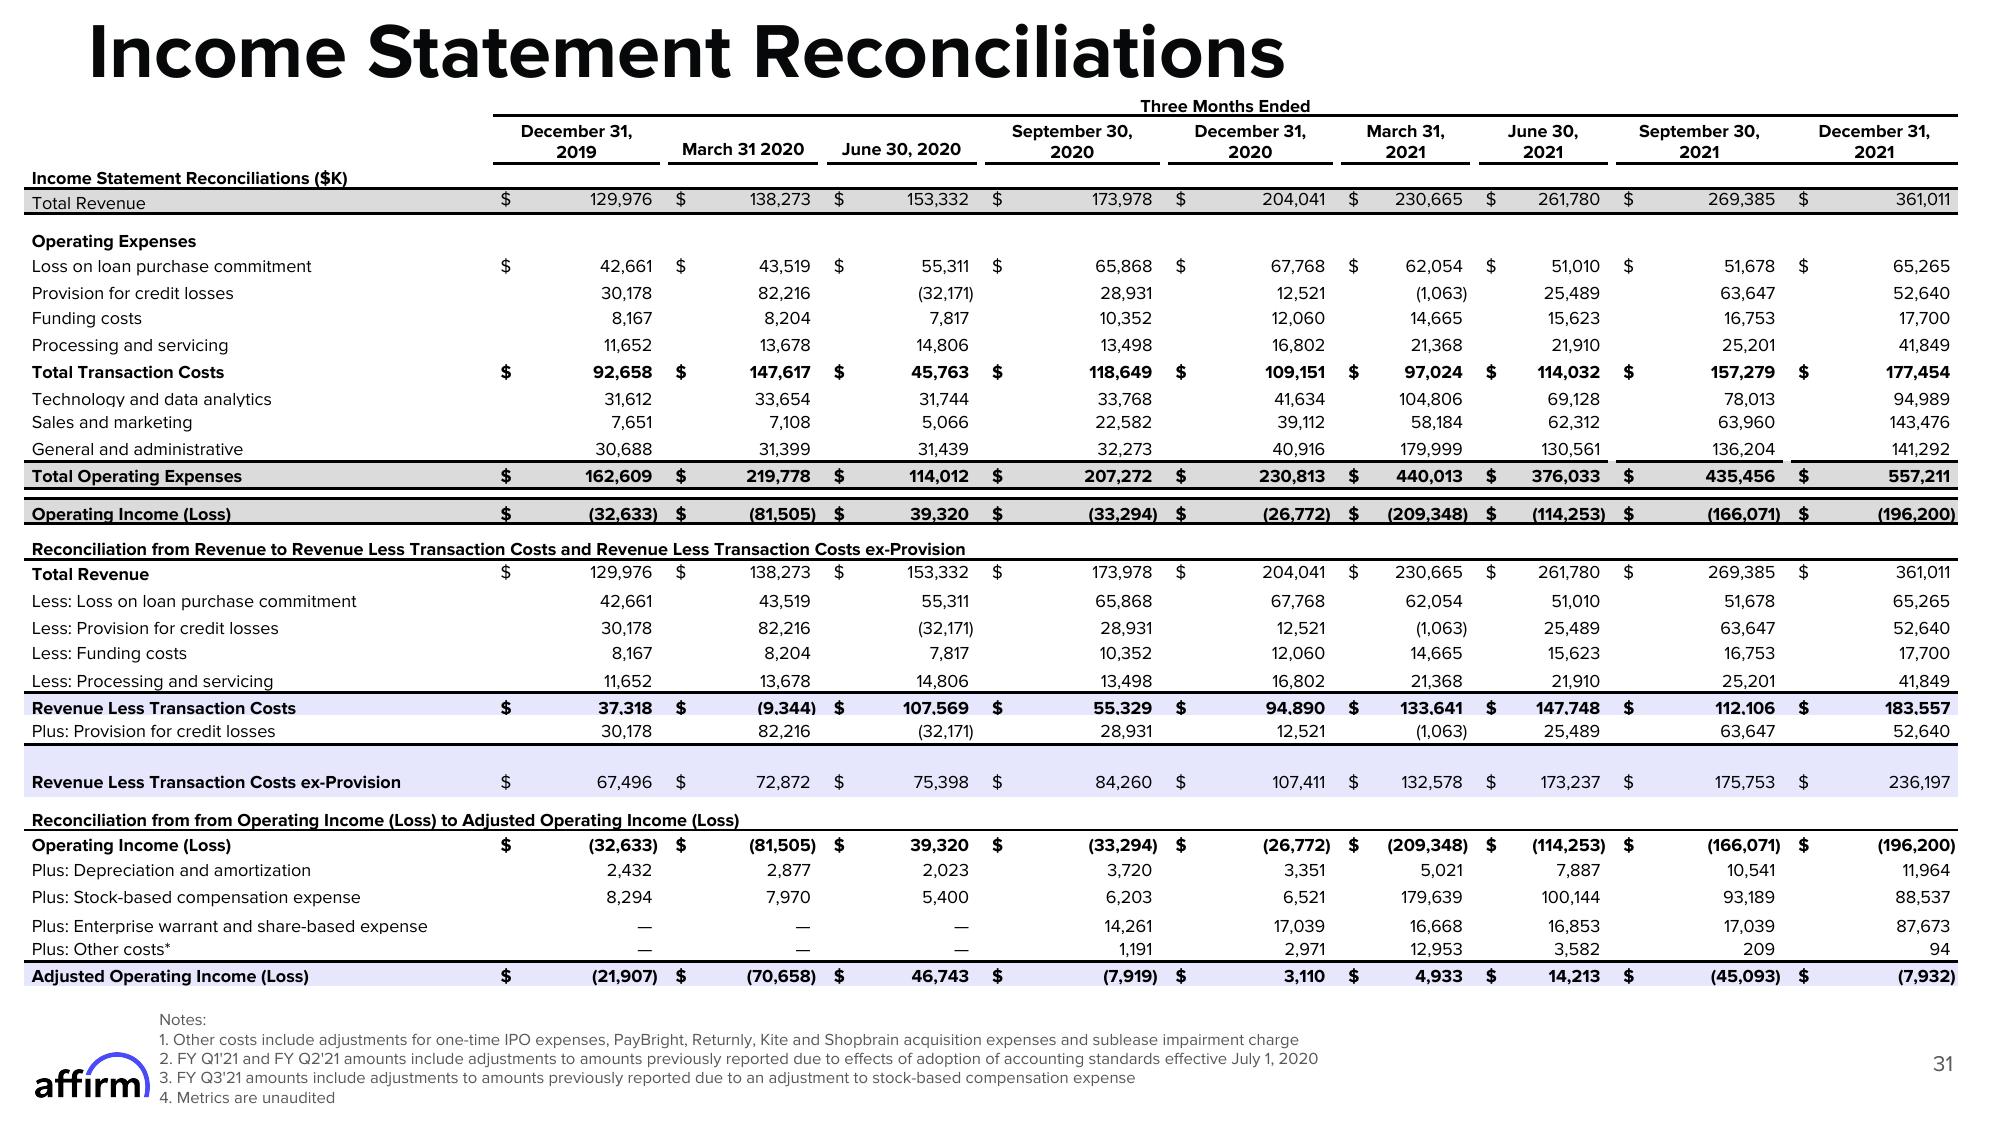
Income Statement Reconciliations ($K)
Total Revenue
Operating Expenses
Loss on loan purchase commitment
Provision for credit losses
Funding costs
Less: Processing and servicing
Revenue Less Transaction Costs
Plus: Provision for credit losses
Statement Reconciliations
December 31,
2019
Plus: Depreciation and amortization
Plus: Stock-based compensation expense
$
Plus: Enterprise warrant and share-based expense
Plus: Other costs*
Adjusted Operating Income (Loss)
$
$
$
42,661
30,178
43,519 $
82,216
8,167
8,204
Processing and servicing
11,652
92,658 $
Total Transaction Costs
Technology and data analytics
Sales and marketing
31,612
7,651
13,678
147,617
33,654
7,108
31,399
219,778 $
(81,505) $
30,688
General and administrative
Total Operating Expenses
Operating Income (Loss)
Reconciliation from Revenue to Revenue Less Transaction Costs and Revenue Less Transaction Costs ex-Provision
Total Revenue
$
162,609 $
(32,633) $
129,976 $
138,273 $
153,332 $
42,661
55,311
Less: Loss on loan purchase commitment
Less: Provision for credit losses
30,178
(32,171)
Less: Funding costs
8,167
7,817
11,652
37,318
30,178
$
March 31 2020
129,976 $
$
Revenue Less Transaction Costs ex-Provision
$
Reconciliation from from Operating Income (Loss) to Adjusted Operating Income (Loss)
Operating Income (Loss)
$
$
$
67,496 $
(32,633) $
2,432
8,294
138,273
(21,907) $
June 30, 2020
43,519
82,216
8,204
$
$
13,678
(9.344) $
82,216
72,872 $
(81,505) $
2,877
7,970
153,332 $
(70,658) $
55,311 $
(32,171)
7,817
14,806
45,763
31,744
5,066
31,439
114,012 $
39,320 $
14,806
107,569
(32,171)
75,398
39,320
2,023
5,400
$
$
$
$
46,743 $
September 30,
2020
Three Months Ended
December 31,
2020
173,978 $
65,868 $
28,931
10,352
13,498
118,649
33,768
22,582
32,273
207,272 $
(33,294) $
173,978 $
65,868
28,931
10,352
$
13,498
55,329 $
28,931
84,260
$
(33,294) $
3,720
6,203
affirm) 3. FY Q3'21 amounts include adjustments to amounts previously reported due to an adjustment to stock-based compensation expense
4. Metrics are unaudited
14,261
1,191
(7,919) $
204,041 $
67,768
12,521
12,060
16,802
109,151 $
41,634
39,112
40,916
230,813 $
(26,772) $
$
204,041 $
67,768
12,521
12,060
16,802
94,890 $
12,521
107,411 $
Notes:
1. Other costs include adjustments for one-time IPO expenses, PayBright, Returnly, Kite and Shopbrain acquisition expenses and sublease impairment charge
2. FY Q1'21 and FY Q2'21 amounts include adjustments to amounts previously reported due to effects of adoption of accounting standards effective July 1, 2020
(26,772) $
3,351
6,521
17,039
2,971
3,110
$
March 31,
2021
230,665 $
June 30,
2021
62,054 $
(1,063)
51,010 $
25,489
14,665
15,623
21,910
21,368
97,024 $ 114,032 $
104,806
58,184
179,999
440,013 $
(209,348) $
69,128
62,312
130,561
376,033 $
(114,253) $
132,578 $
261,780 $
230,665 $
62,054
(1,063)
261,780
51,010
25,489
14,665
15,623
21,368
21,910
133.641 $ 147.748
(1,063)
25,489
(209,348) $
5,021
179,639
16,668
12,953
4,933 $
173,237 $
(114,253) $
7,887
100,144
16,853
3,582
14,213
$
September 30,
2021
269,385
$
51,678
63,647
16,753
25,201
157,279
78,013
63,960
136,204
435,456 $
(166,071) $
$
25,201
112,106
63,647
$
269,385 $
51,678
63,647
16,753
$
175,753 $
(166,071) $
10,541
93,189
17,039
209
(45,093) $
December 31,
2021
361,011
65,265
52,640
17,700
41,849
177,454
94,989
143,476
141,292
557,211
(196,200)
361,011
65,265
52,640
17,700
41,849
183,557
52,640
236,197
(196,200)
11,964
88,537
87,673
94
(7,932)
31View entire presentation