Embark Results Presentation Deck
THE EMBARK COVERAGE MAP - LAUNCH OF COAST-TO-
COAST AUTONOMOUS TRUCKING NETWORK
●
Coast-to-Coast Coverage Map Highlights
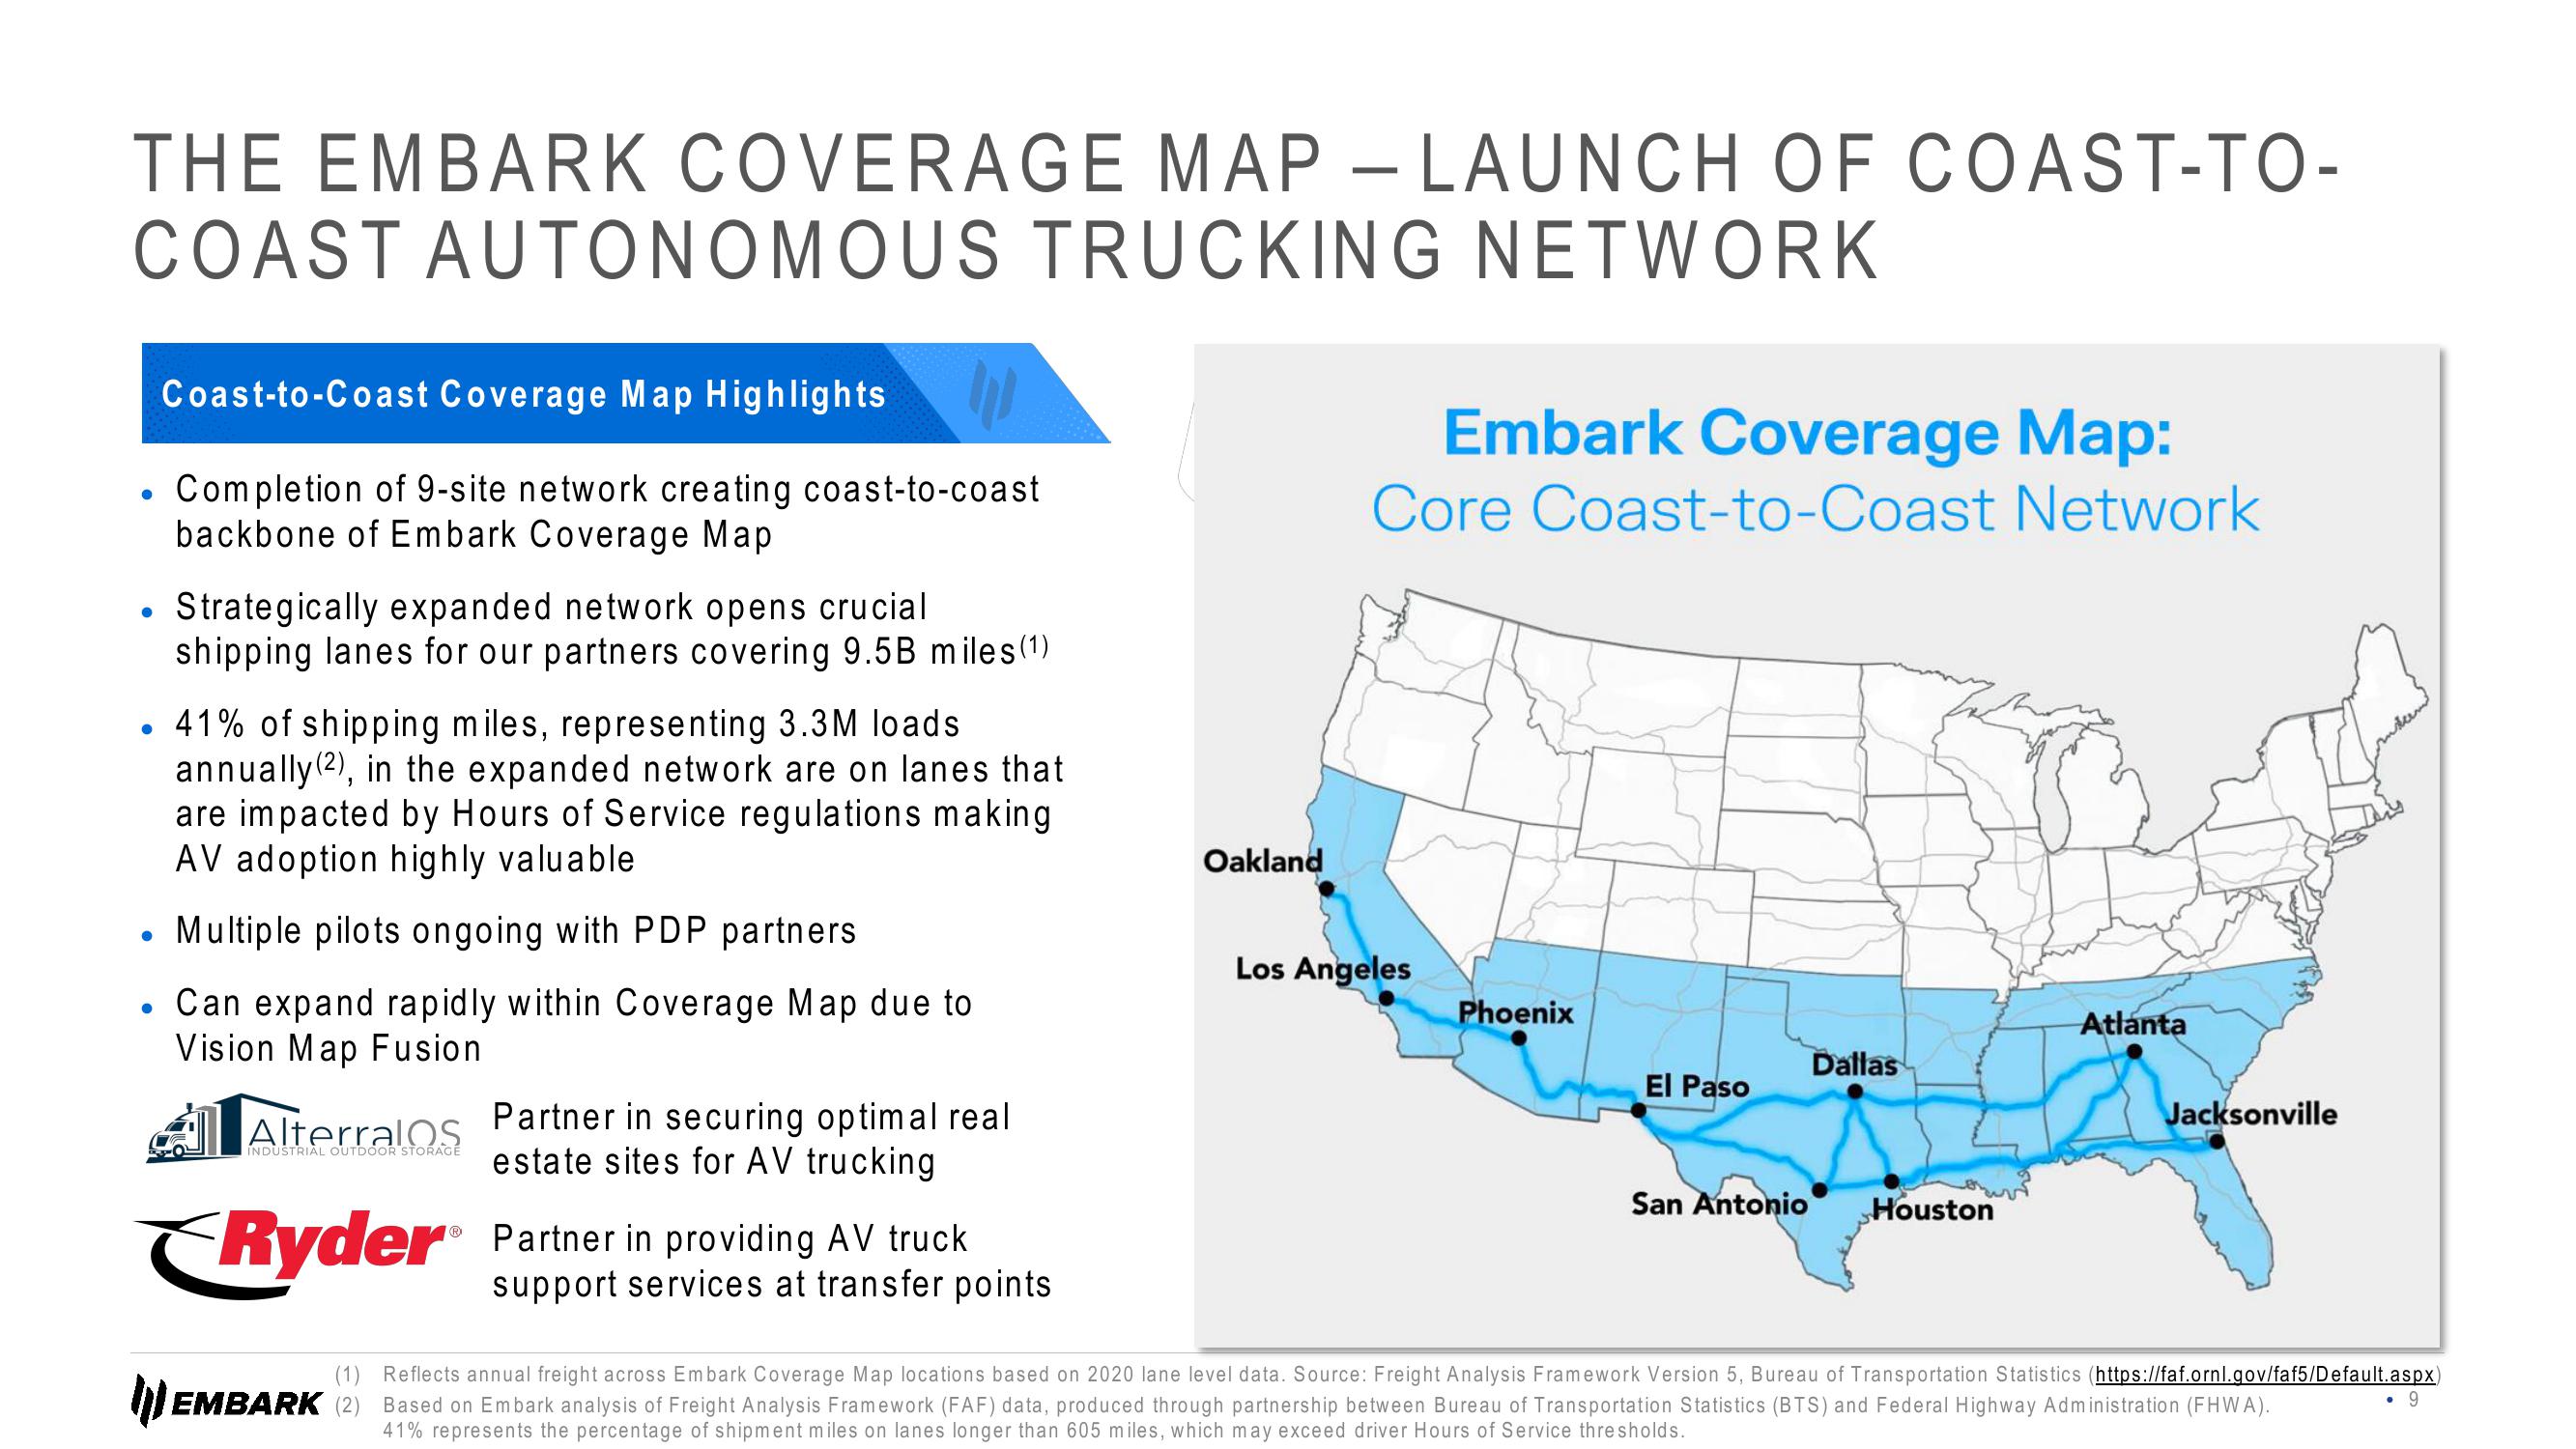
Completion of 9-site network creating coast-to-coast
backbone of Embark Coverage Map
41% of shipping miles, representing 3.3M loads
annually (2), in the expanded network are on lanes that
are impacted by Hours of Service regulations making
AV adoption highly valuable
Multiple pilots ongoing with PDP partners
. Can expand rapidly within Coverage Map due to
Vision Map Fusion
●
Strategically expanded network opens crucial
shipping lanes for our partners covering 9.5B miles (1)
INDUSTRIAL OUTDOOR STORAGE
Ryder®
Partner in securing optimal real
estate sites for AV trucking
Partner in providing AV truck
support services at transfer points
Oakland
Embark Coverage Map:
Core Coast-to-Coast Network
Los Angeles
Phoenix
El Paso
San Antonio
Dallas
Houston
Atlanta
Jacksonville
EMBARK (2)
(1) Reflects annual freight across Embark Coverage Map locations based on 2020 lane level data. Source: Freight Analysis Framework Version 5, Bureau of Transportation Statistics (https://faf.ornl.gov/faf5/Default.aspx)
Based on Embark analysis of Freight Analysis Framework (FAF) data, produced through partnership between Bureau of Transportation Statistics (BTS) and Federal Highway Administration (FHWA).
41% represents the percentage of shipment miles on lanes longer than 605 miles, which may exceed driver Hours of Service thresholds.
. 9View entire presentation