Livongo Investor Presentation Deck
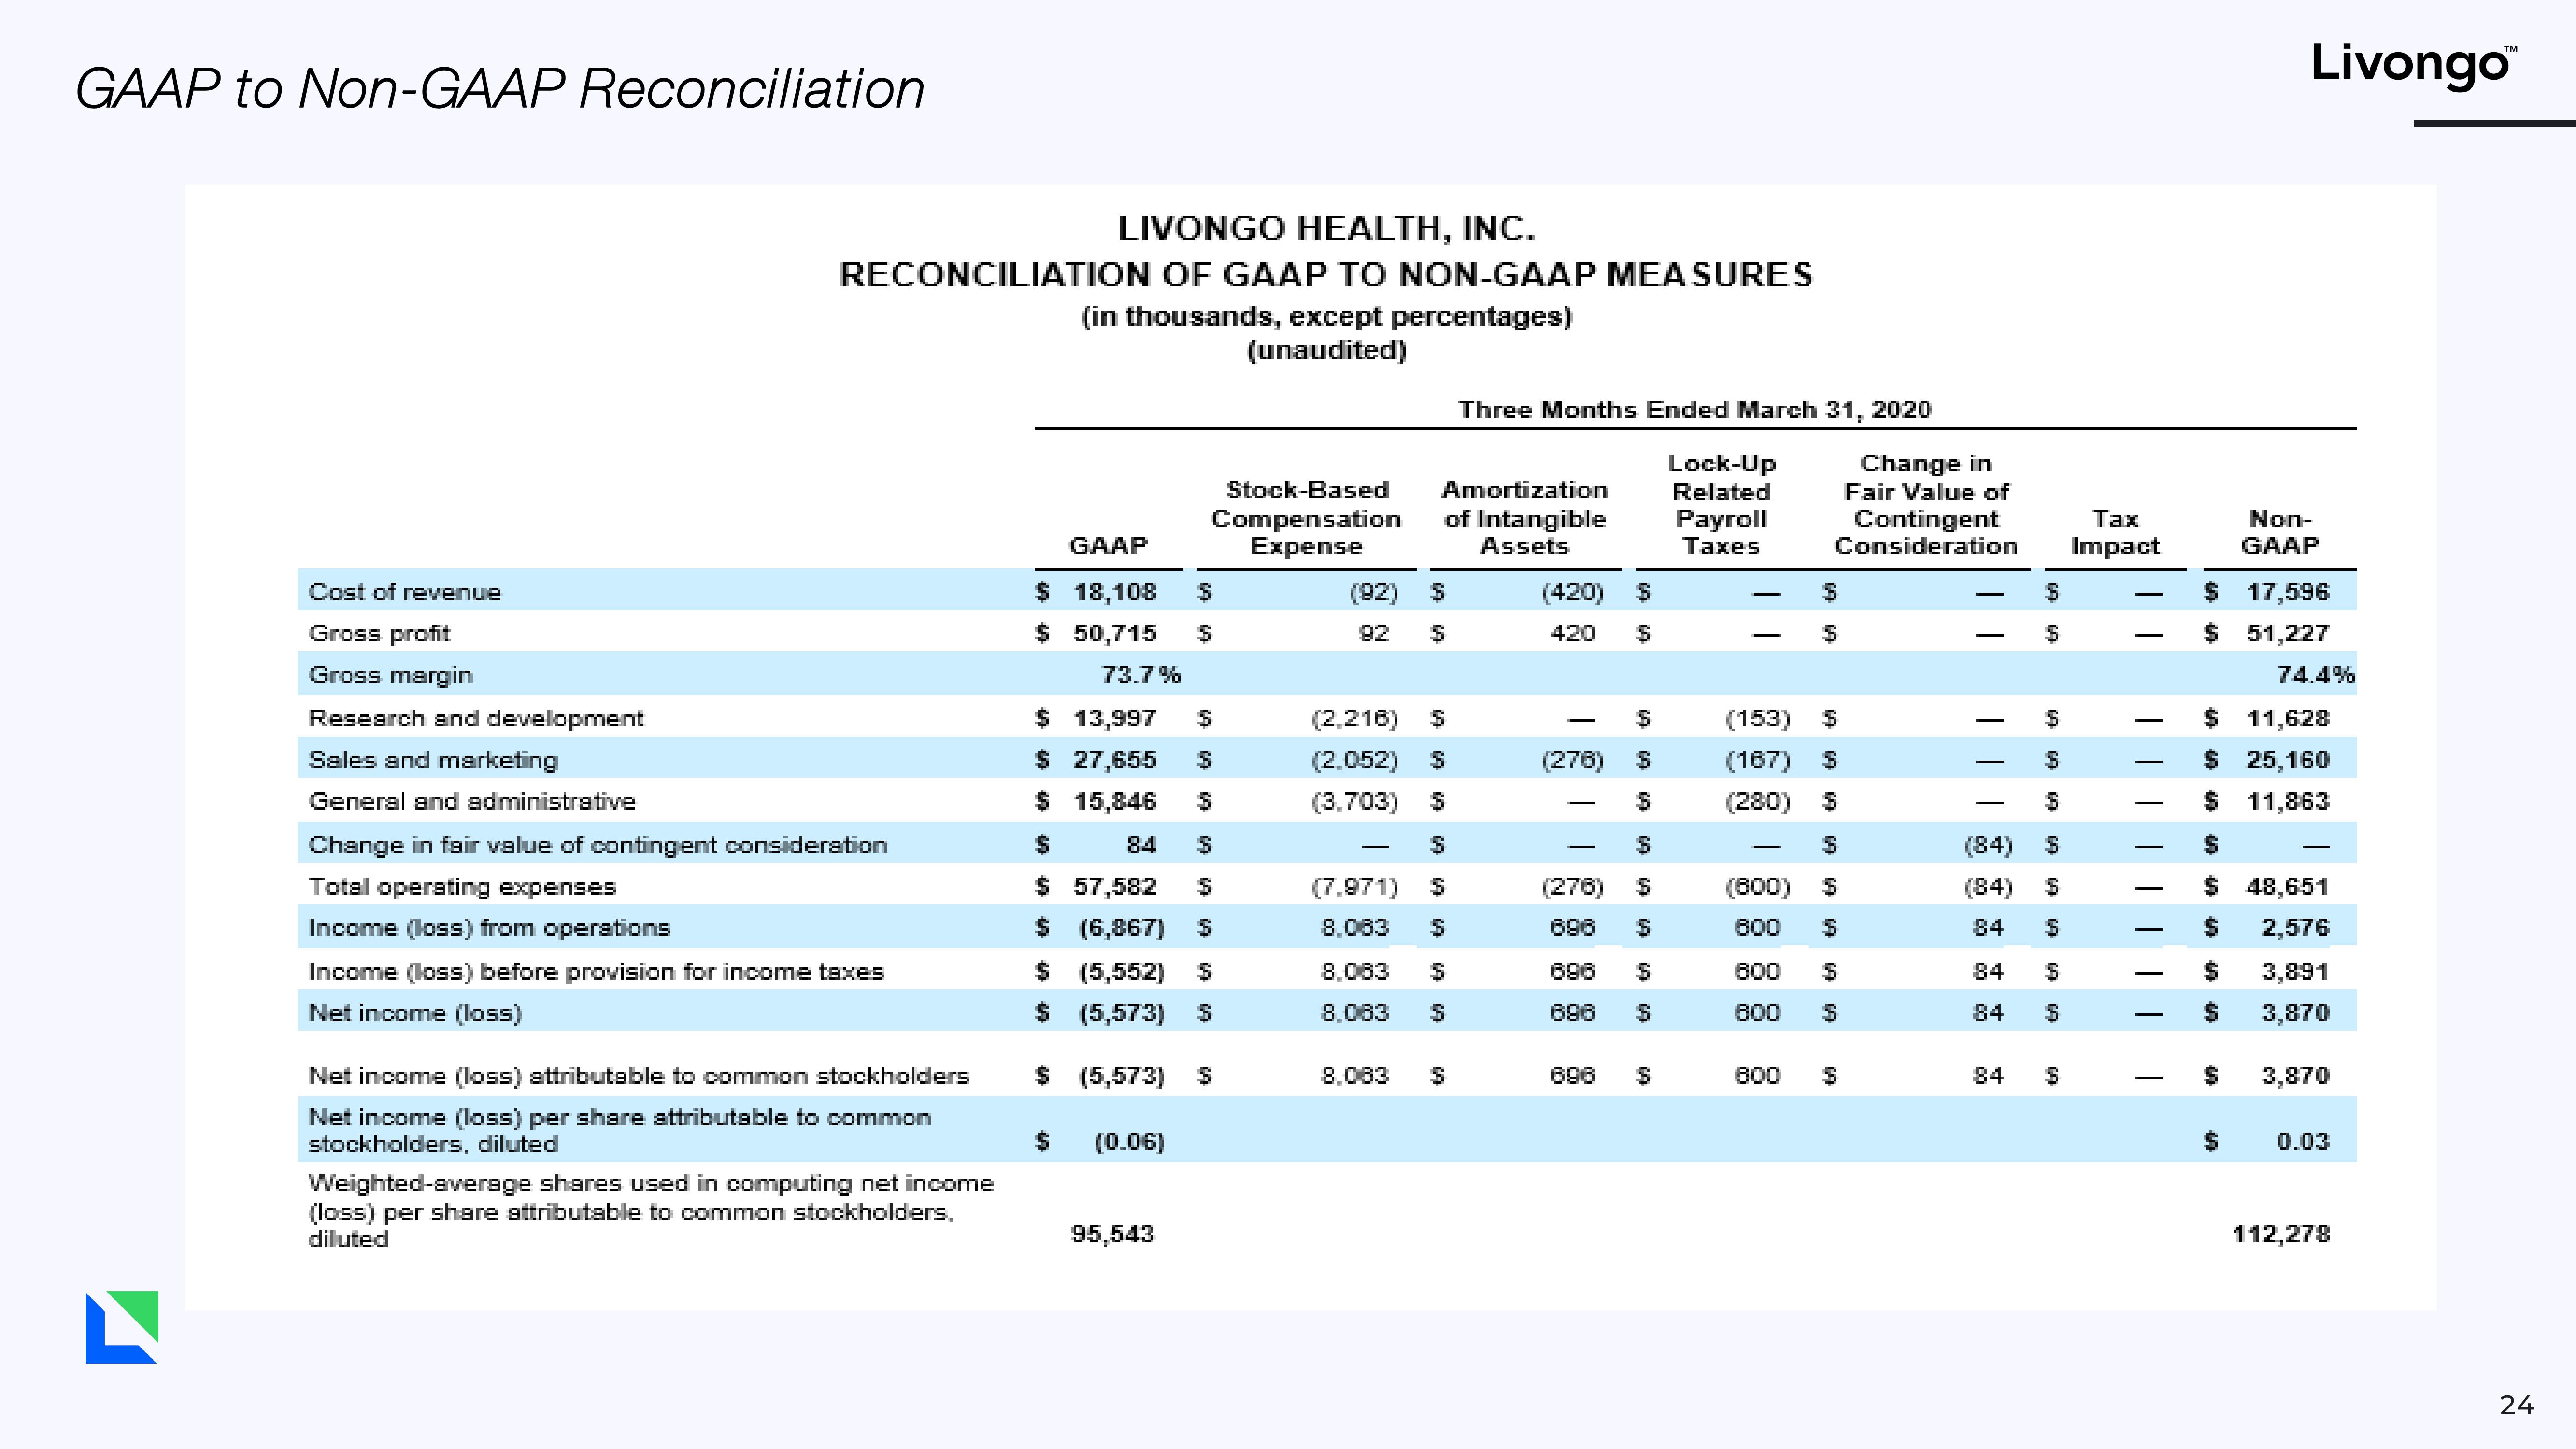
GAAP to Non-GAAP Reconciliation
LIVONGO HEALTH, INC.
RECONCILIATION OF GAAP TO NON-GAAP MEASURES
(in thousands, except percentages)
(unaudited)
Cost of revenue
Gross profit
Gross margin
Research and development
Sales and marketing
General and administrative
Change in fair value of contingent consideration
Total operating expenses
Income (loss) from operations
Income (loss) before provision for income taxes
Net income (loss)
Net income (loss) attributable to common stockholders
Net income (loss) per share attributable to common
stockholders, diluted
Weighted-average shares used in computing net income
(loss) per share attributable to common stockholders.
diluted
GAAP
$ 18,108 $
$ 50,715 $
73.7%
Stock-Based
Compensation
Expense
$ 13,997 5
$ 27,655 S
$
$ 15,846
$
84
S
$ 57,582
S
$ (6,867) $
$ (5,552) $
$ (5,573) $
$ (5,573)
(0.06)
$
95,543
Amortization
of Intangible
Assets
(92) S
92 $
(2.216) $
(2,052) $
(3.703) $
$
(7.971) S
8.083 S
8.083 $
8.083 $
Three Months Ended March 31, 2020
8,083 $
(420) S
420 $
(276)
-
(276)
696
696
696
696
S
$
$
69 69 69 69 60
$
Lock-Up
Related
Payroll
Taxes
Change in
Fair Value of
Contingent
Consideration
S
S
(153) S
(167) $
(280) S
800
$
(800) S
800 S
800 $
600 $
69
S
S
S
$
3
(84) S
(84) $
84
S
84
$
84 S
84 $
Tax
Impact
Livongo™
$ 17,596
$ 51,227
$
$
Non-
GAAP
$
$ 11,628
$ 25,160
$ 11,863
$
$
$
74.4%
-
48,651
2,576
3,891
3,870
3,870
0.03
112,278
24View entire presentation