First Quarter 2017 Financial Review
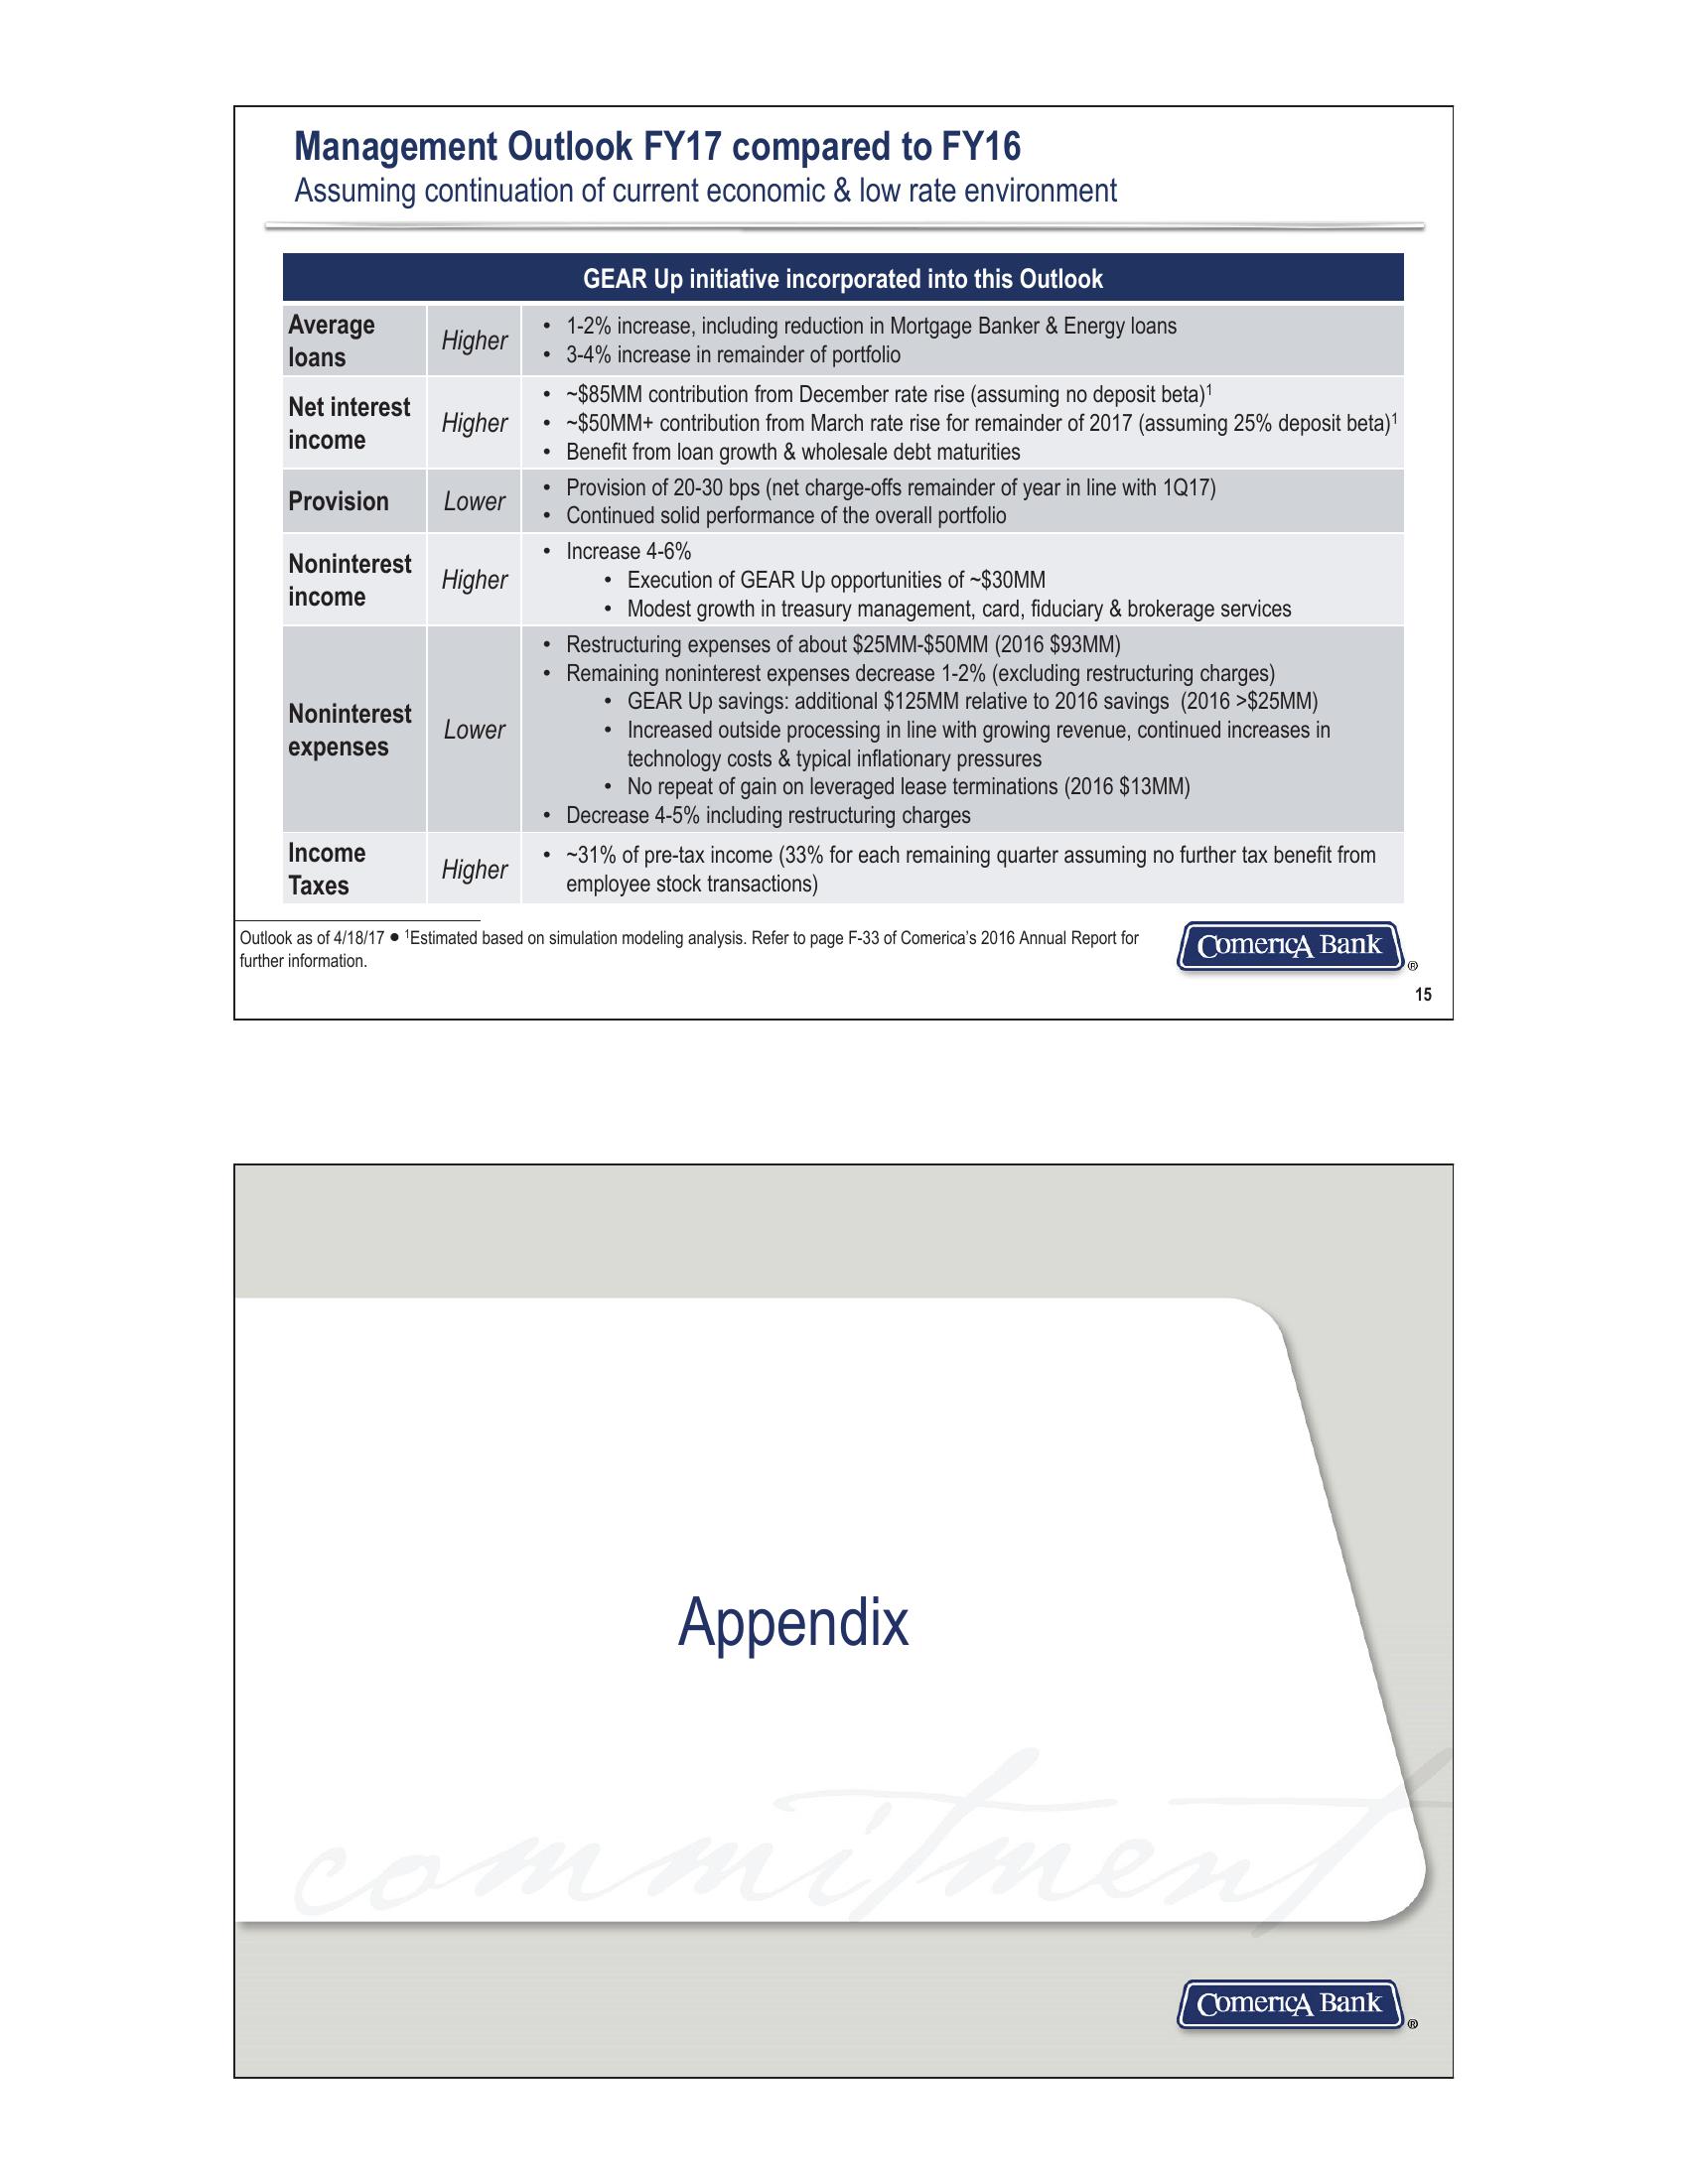
Management Outlook FY17 compared to FY16
Assuming continuation of current economic & low rate environment
GEAR Up initiative incorporated into this Outlook
~$50MM+ contribution from March rate rise for remainder of 2017 (assuming 25% deposit beta)1
Benefit from loan growth & wholesale debt maturities
Average
loans
1-2% increase, including reduction in Mortgage Banker & Energy loans
Higher
•
3-4% increase in remainder of portfolio
•
-$85MM contribution from December rate rise (assuming no deposit beta)1
Net interest
income
Higher
•
Provision
Lower
Noninterest
income
Higher
Noninterest
Lower
expenses
Income
Taxes
Higher
•
Provision of 20-30 bps (net charge-offs remainder of year in line with 1Q17)
Continued solid performance of the overall portfolio
Increase 4-6%
•
Execution of GEAR Up opportunities of ~$30MM
Modest growth in treasury management, card, fiduciary & brokerage services
Restructuring expenses of about $25MM-$50MM (2016 $93MM)
Remaining noninterest expenses decrease 1-2% (excluding restructuring charges)
.
•
GEAR Up savings: additional $125MM relative to 2016 savings (2016>$25MM)
Increased outside processing in line with growing revenue, continued increases in
technology costs & typical inflationary pressures
No repeat of gain on leveraged lease terminations (2016 $13MM)
Decrease 4-5% including restructuring charges
~31% of pre-tax income (33% for each remaining quarter assuming no further tax benefit from
employee stock transactions)
Outlook as of 4/18/17 1Estimated based on simulation modeling analysis. Refer to page F-33 of Comerica's 2016 Annual Report for
further information.
Comerica Bank
Ⓡ
com
Appendix
mitment
Comerica Bank
15View entire presentation