Q2 FY24 Earnings Presentation
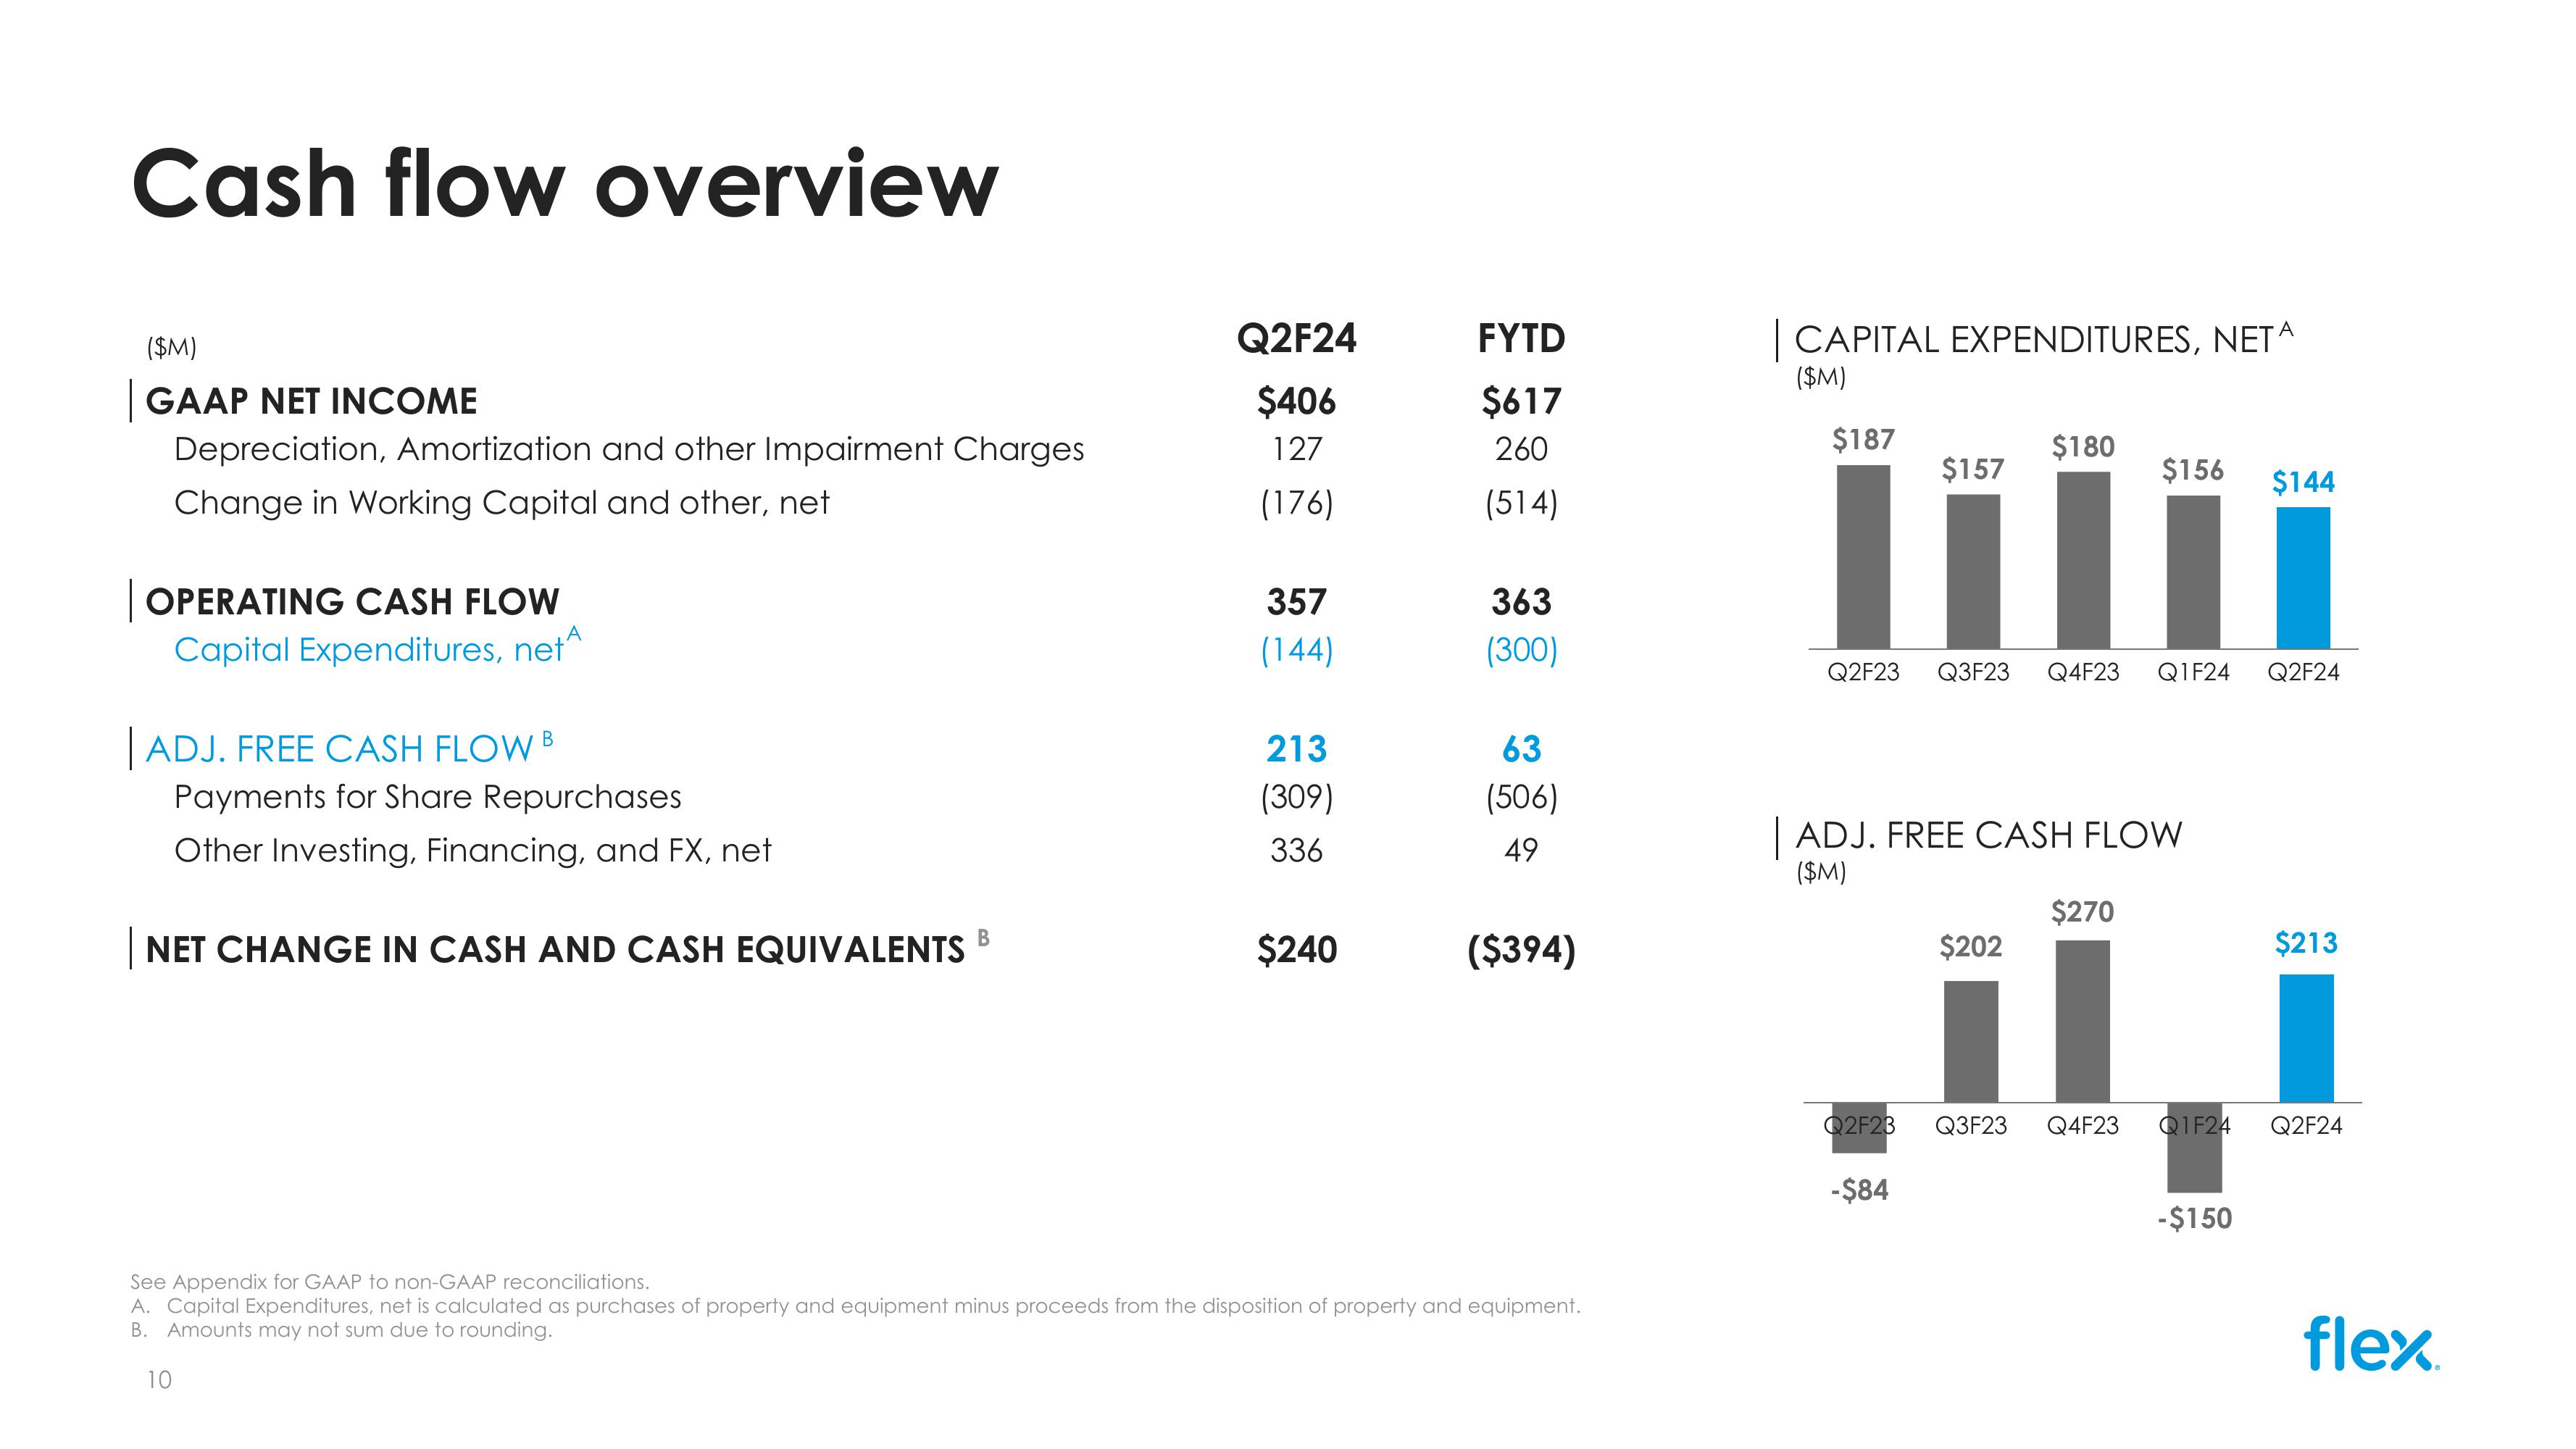
Cash flow overview
($M)
Q2F24
FYTD
| CAPITAL EXPENDITURES, NET^
($M)
| GAAP NET INCOME
$406
$617
Depreciation, Amortization and other Impairment Charges
Change in Working Capital and other, net
127
260
$187
$180
$157
$156
$144
(176)
(514)
| OPERATING CASH FLOW
357
363
Capital Expenditures, net"
| ADJ. FREE CASH FLOW B
Payments for Share Repurchases
Other Investing, Financing, and FX, net
(144)
(300)
Q2F23 Q3F23 Q4F23 Q1F24 Q2F24
213
63
(309)
(506)
336
49
ADJ. FREE CASH FLOW
($M)
B
NET CHANGE IN CASH AND CASH EQUIVALENTS
$240
($394)
$270
$202
$213
See Appendix for GAAP to non-GAAP reconciliations.
A. Capital Expenditures, net is calculated as purchases of property and equipment minus proceeds from the disposition of property and equipment.
B. Amounts may not sum due to rounding.
10
Q2F23
Q3F23
Q4F23 Q1F24
Q2F24
-$84
-$150
flex.View entire presentation