Uber Results Presentation Deck
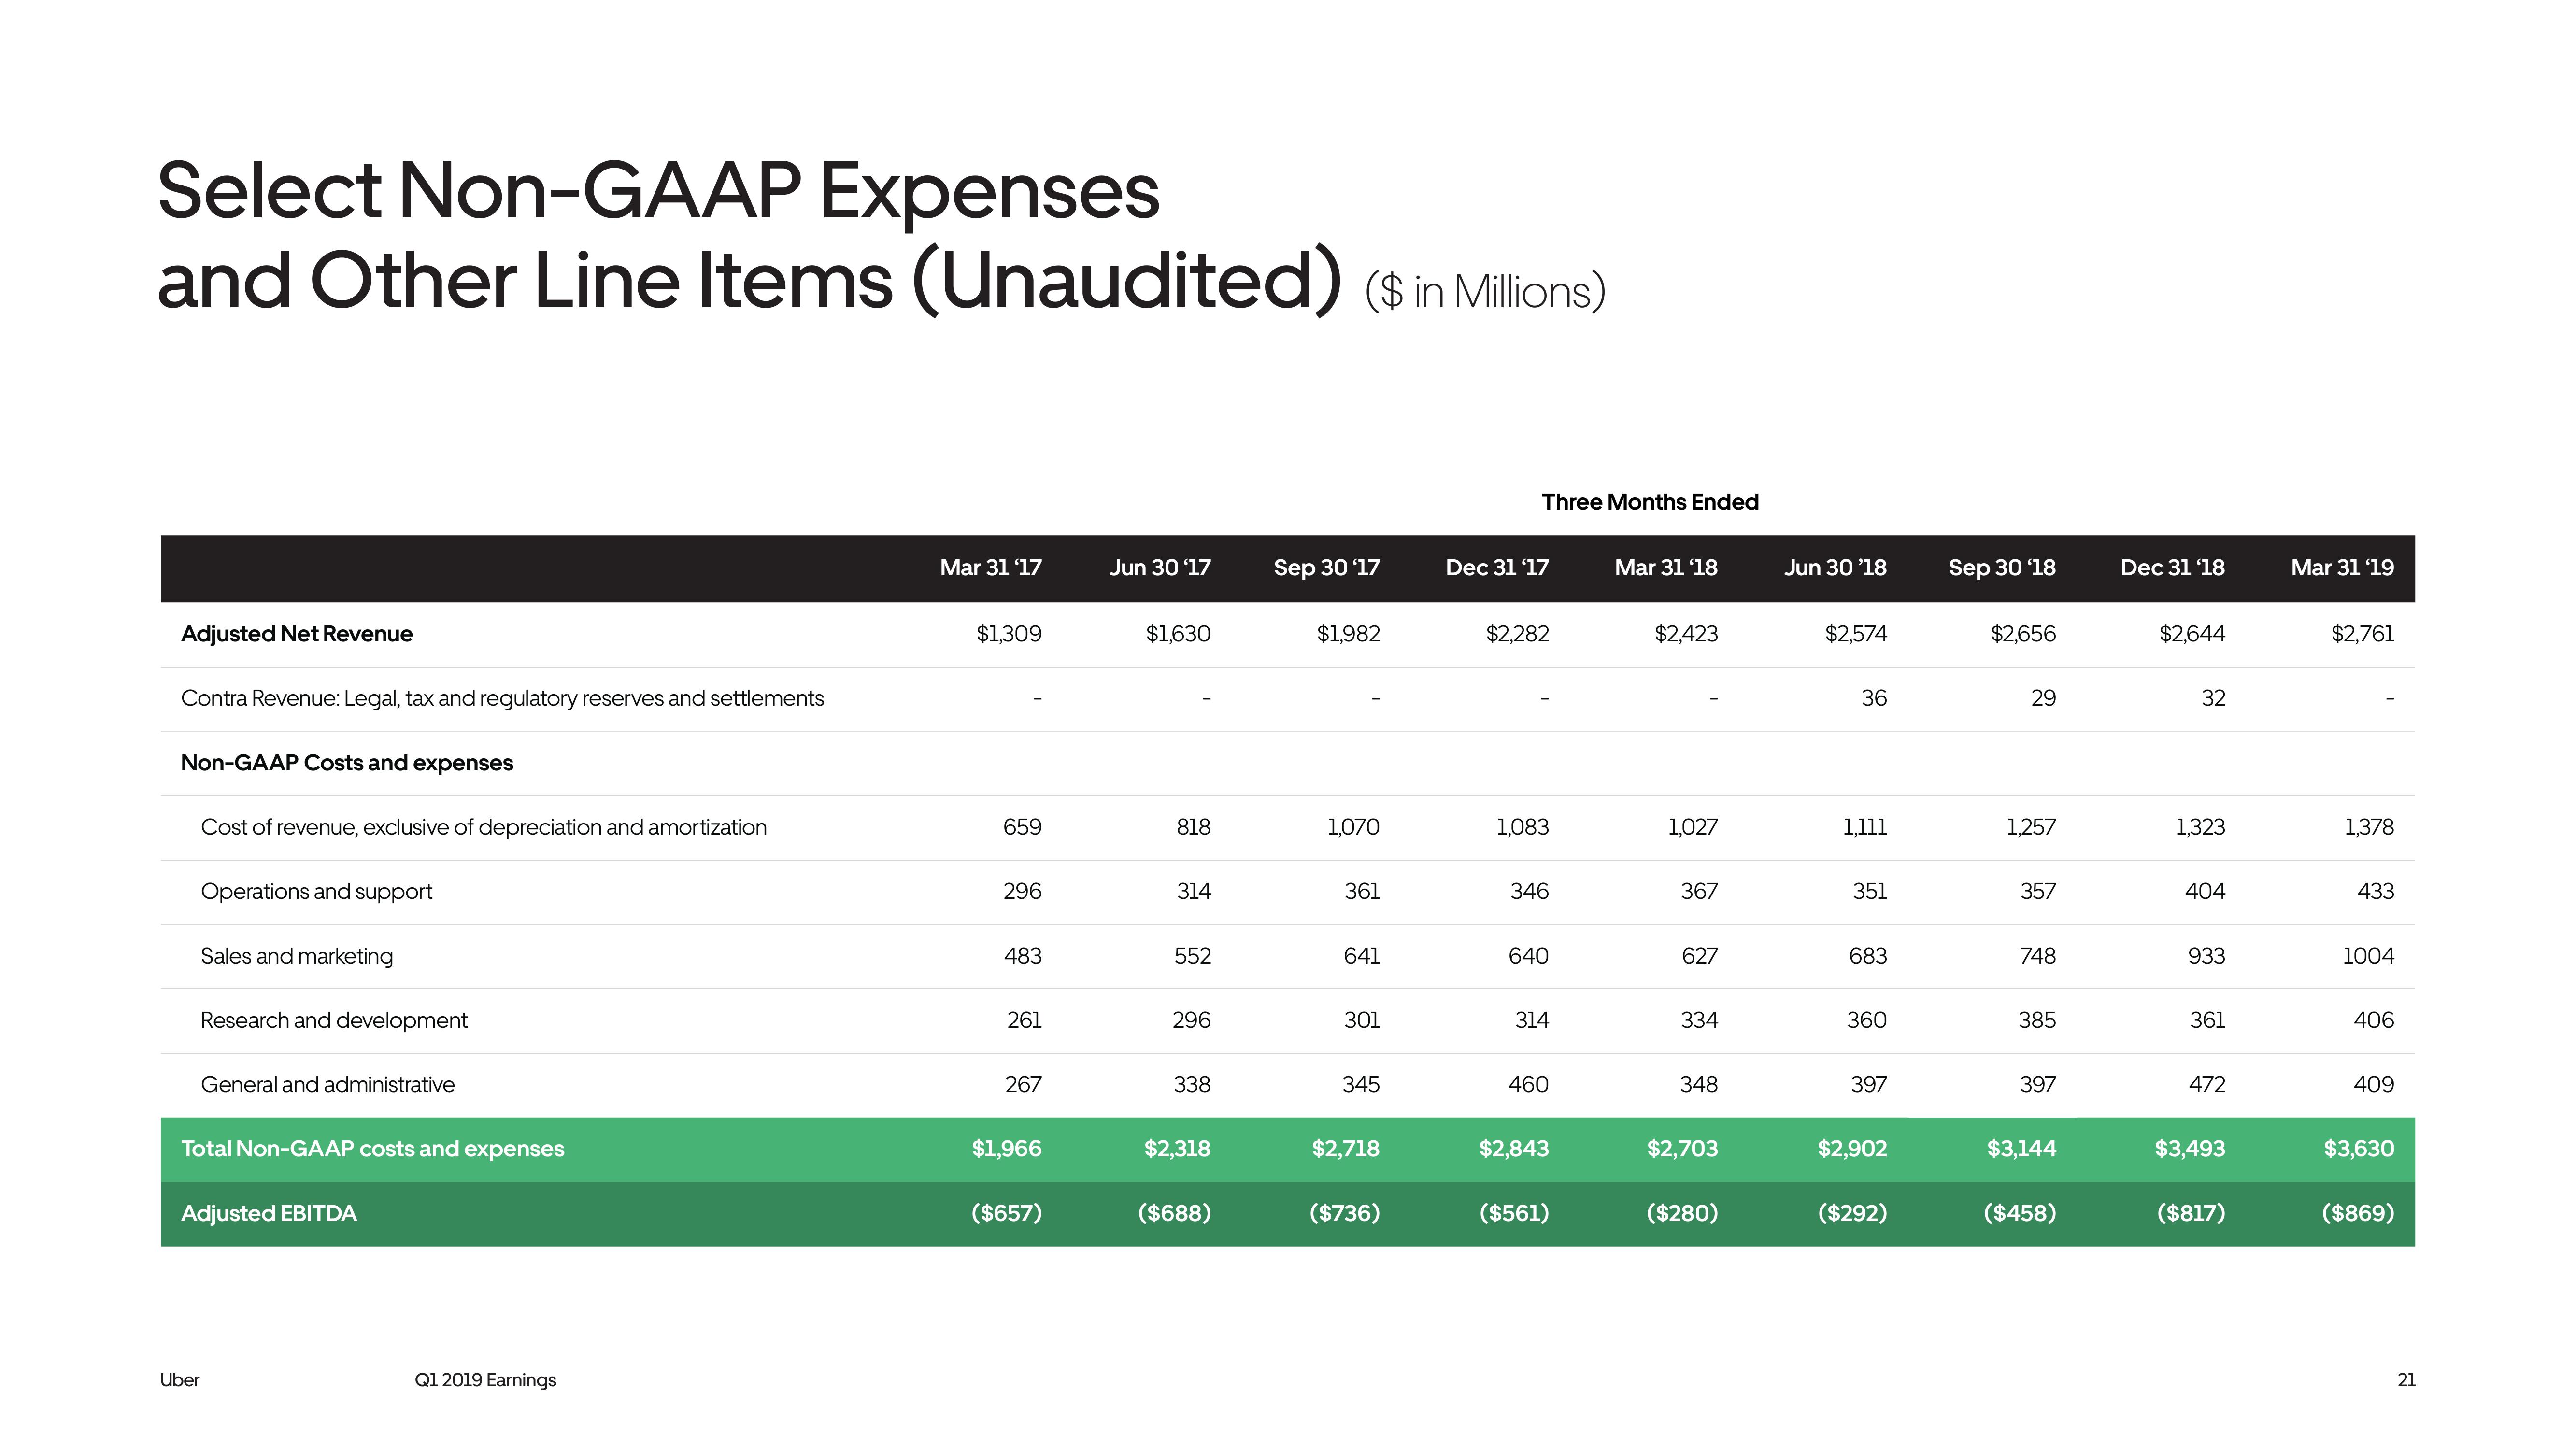
Select Non-GAAP Expenses
and Other Line Items (Unaudited) (in Millions)
Adjusted Net Revenue
Contra Revenue: Legal, tax and regulatory reserves and settlements
Non-GAAP Costs and expenses
Cost of revenue, exclusive of depreciation and amortization
Operations and support
Uber
Sales and marketing
Research and development
General and administrative
Total Non-GAAP costs and expenses
Adjusted EBITDA
Q1 2019 Earnings
Mar 31 '17
$1,309
659
296
483
261
267
$1,966
($657)
Jun 30'17
$1,630
818
314
552
296
338
$2,318
($688)
Sep 30 '17
$1,982
1,070
361
641
301
345
$2,718
($736)
Three Months Ended
Dec 31 '17
$2,282
1,083
346
640
314
460
$2,843
($561)
Mar 31 '18
$2,423
1,027
367
627
334
348
$2,703
($280)
Jun 30 '18
$2,574
36
1,111
351
683
360
397
$2,902
($292)
Sep 30 '18
$2,656
29
1,257
357
748
385
397
$3,144
($458)
Dec 31 '18
$2,644
32
1,323
404
933
361
472
$3,493
($817)
Mar 31 '19
$2,761
1,378
433
1004
406
409
$3,630
($869)
21View entire presentation