Commercial Metals Company Investor Presentation Deck
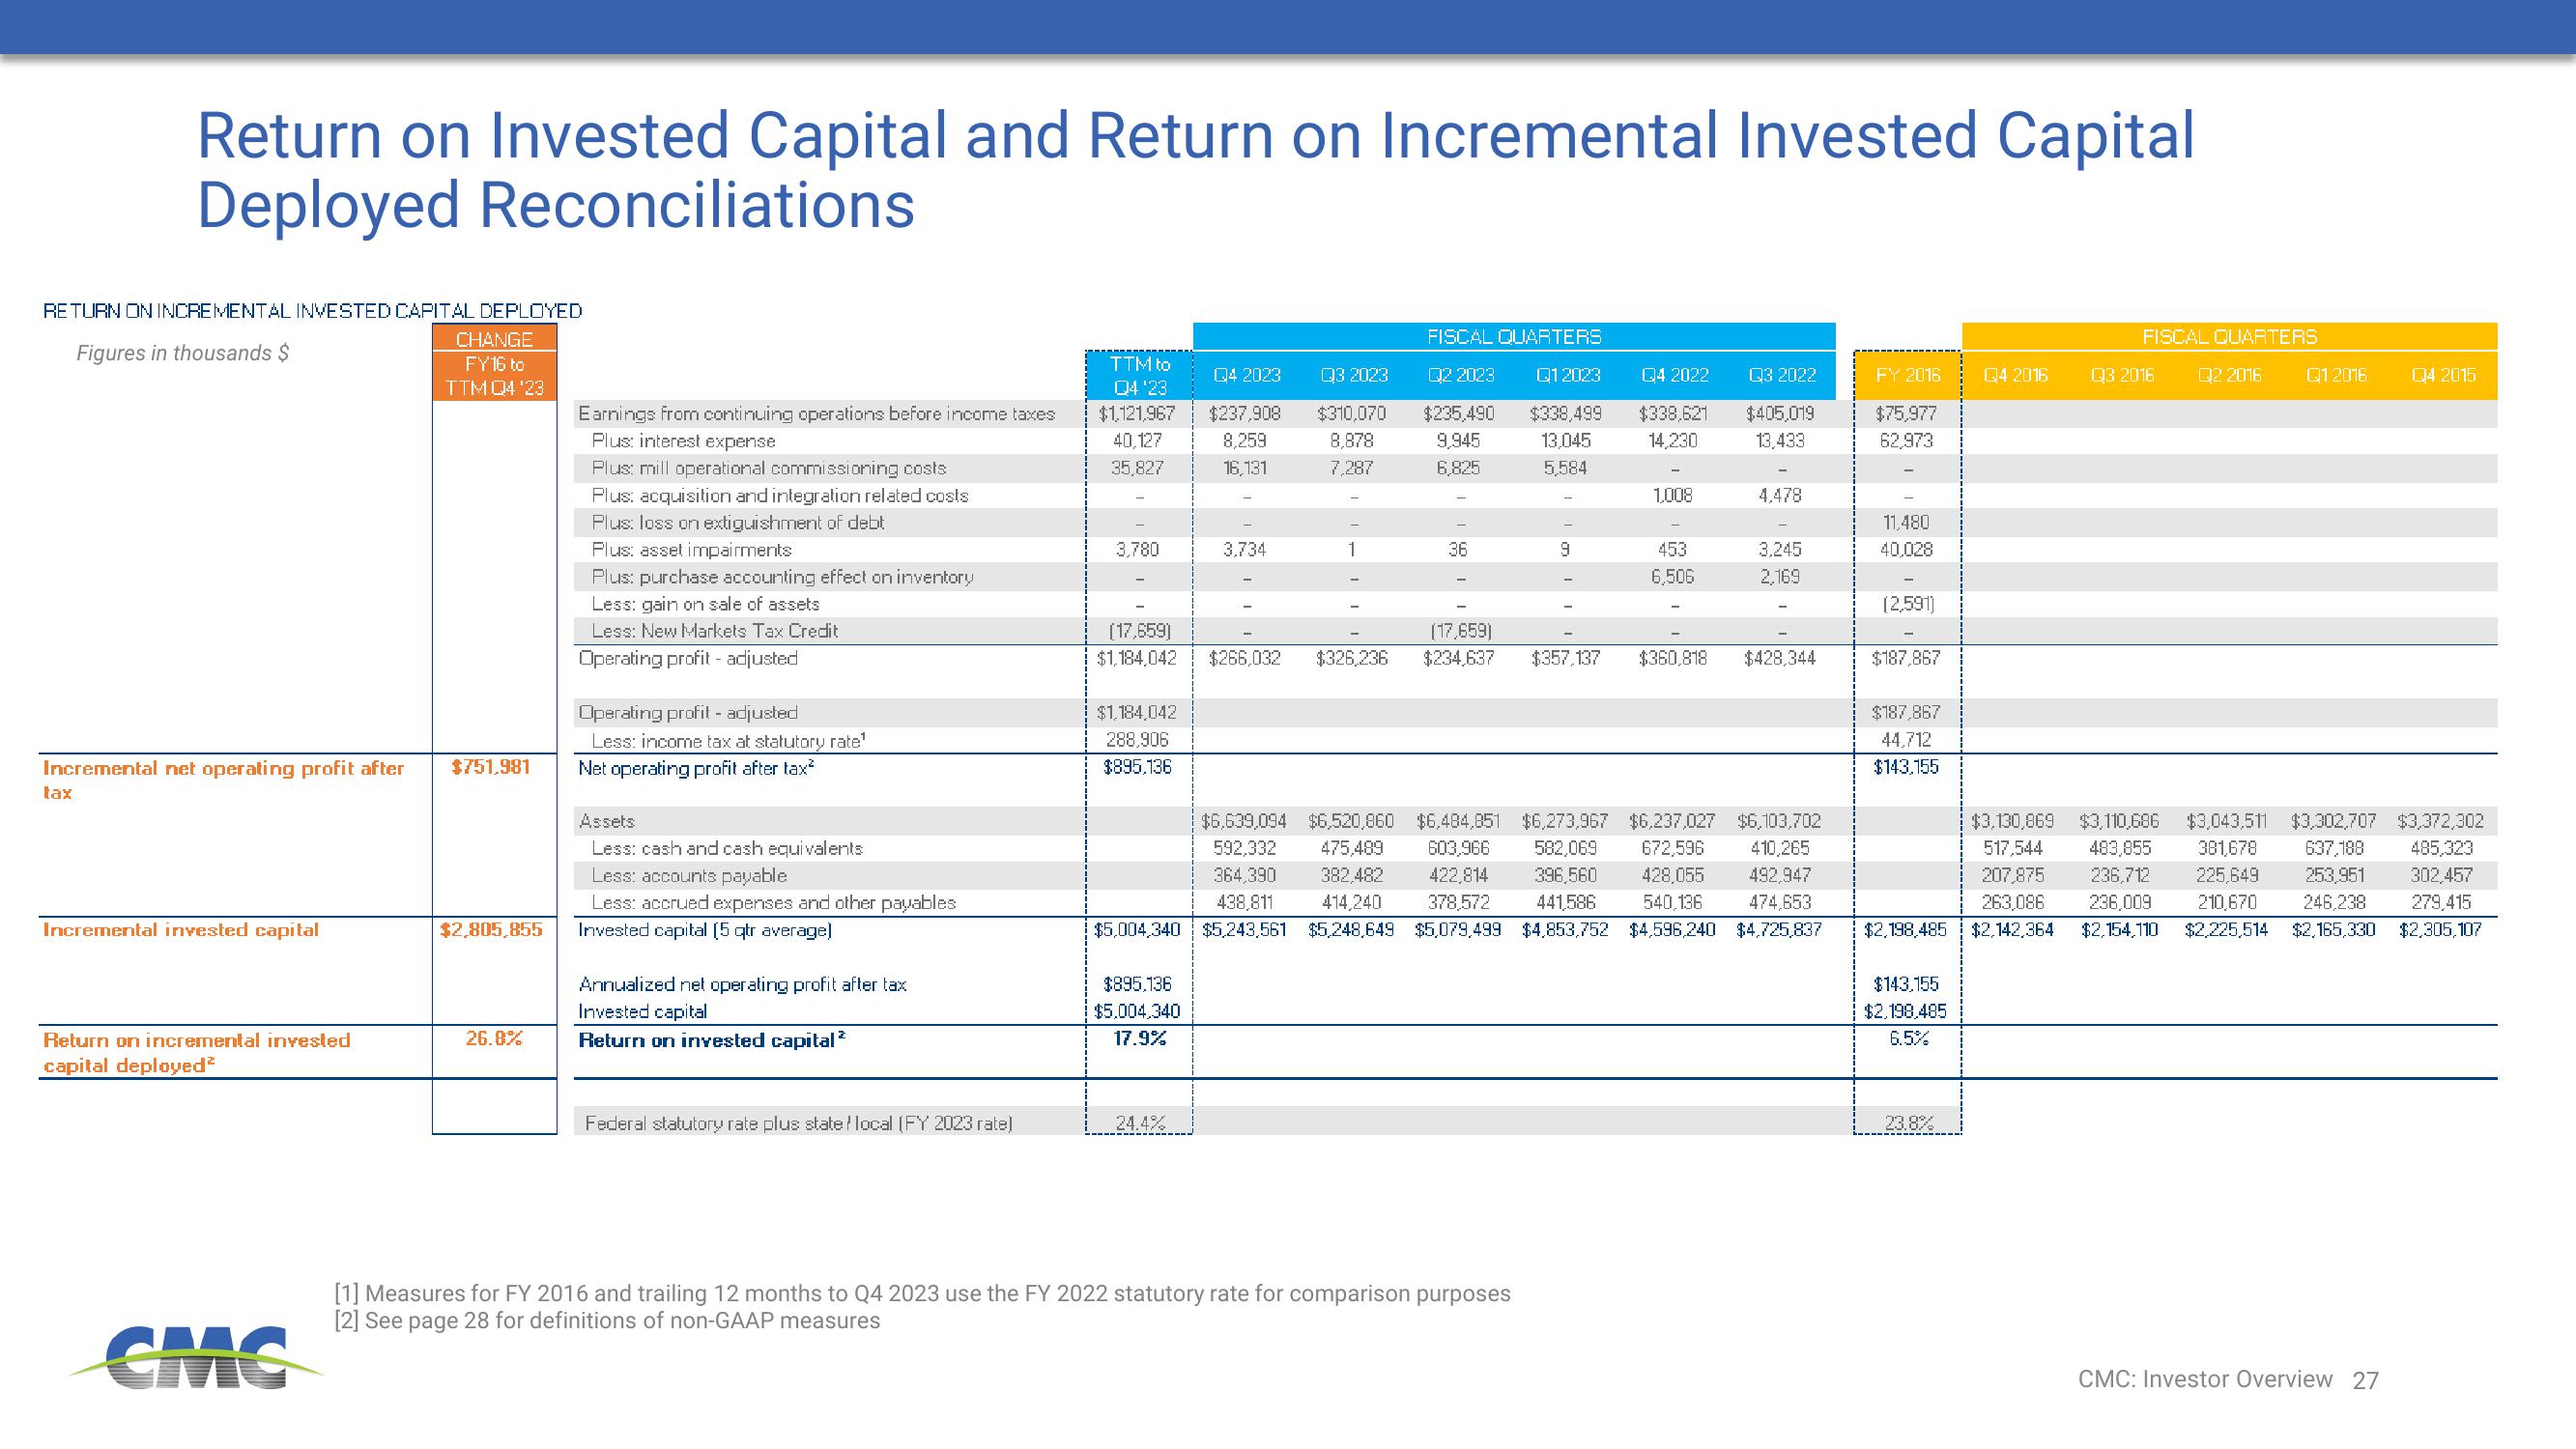
Return on Invested Capital and Return on Incremental Invested Capital
Deployed Reconciliations
RETURN ON INCREMENTAL INVESTED CAPITAL DEPLOYED
Figures in thousands $
Incremental net operating profit after
tax
Incremental invested capital
Return on incremental invested
capital deployed²
CMC
CHANGE
FY16 to
TTM Q4 '23
$751,981
$2,805,855
26.8%
Earnings from continuing operations before income taxes
Plus: interest expense
Plus: mill operational commissioning costs
Plus: acquisition and integration related costs
Plus: loss on extiguishment of debt
Plus: asset impairments
Plus: purchase accounting effect on inventory
Less: gain on sale of assets
Less: New Markets Tax Credit
Operating profit - adjusted
Operating profit - adjusted
Less: income tax at statutory rate¹
Net operating profit after tax²
Assets
Less: cash and cash equivalents
Less: accounts payable
Less: accrued expenses and other payables
Invested capital (5 qtr average]
Annualized net operating profit after tax
Invested capital
Return on invested capital ²
Federal statutory rate plus state local (FY 2023 rate)
TTM to
Q4 '23
$1,121,967
40,127
35,827
3,780
$1,184,042
288,906
$895.136
Q4 2023
$237,908
8,259
16,131
$895,136
$5.004,340
17.9%
3,734
24.4%
Q3 2023
$310,070
8,878
7,287
(17,659)
$1,184,042 $266,032 $326,236
-
1
FISCAL QUARTERS
Q2 2023
$235,490
9,945
6,825
Q12023
$338,499
13,045
5,584
36
-
9
[1] Measures for FY 2016 and trailing 12 months to Q4 2023 use the FY 2022 statutory rate for comparison purposes
[2] See page 28 for definitions of non-GAAP measures
-
Q4 2022
$338,621
14,230
1,008
453
6,506
Q3 2022
$405,019
13,433
4.478
$6,639,094 $6,520,860 $6,484,851 $6,273,967 $6,237,027 $6,103,702
592,332 475,489 603,966 582,069 672,596 410,265
364,390 382.482 422,814 396,560 428,055 492,947
438,811 414,240 378,572 441,586 540,136 474,653
$5,004.340 $5,243,561 $5,248,649 $5,079,499 $4,853,752 $4,596,240 $4.725,837
3,245
2,169
(17,659)
$234,637 $357,137 $360,818 $428,344
FY 2016
$75,977
62,973
11,480
40,028
(2,591)
$187,867
$187,867
44.712
$143.155
$143,155
$2,198,485
6.5%
Q4 2016
23.8%
FISCAL QUARTERS
Q3 2016
02 2016
Q1 2016
$3,130,869 $3,110,686 $3,043,511 $3,302,707 $3,372,302
517,544 483,855 381,678 637,188 485,323
207,875 236,712 225,649 253.951 302,457
263,086 236,009 210,670 246,238 279,415
$2,198,485 $2,142,364 $2,154,110 $2,225,514 $2,165,330 $2,305,107
Q4 2015
CMC: Investor Overview 27View entire presentation